
Datadog Logs Playbook
Introduction
Datadog is where we host our server logs. It’s a useful tool when it comes to searching for information about transcription and Lemur requests, accounts, throttling, monitoring API performance and more.
Note that we have a separate Datadog for EU requests datadoghq.eu/dashboard/lists.
Useful Log Queries for Async Transcripts
To search the logs for a transcript, navigate to the Logs datadoghq.com/logs?query=&agg_m=count&agg_m_source=base&agg_t=count&cols=host%2Cservice&fromUser=true&messageDisplay=inline&refresh_mode=sliding&storage=hot&stream_sort=desc&viz=stream&from_ts=1714936157535&to_ts=1717528157535&live=true page, using the sidebar.
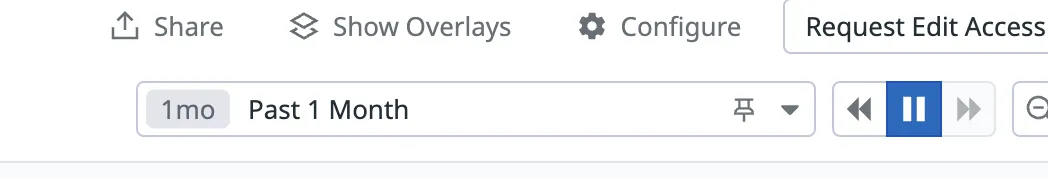
Once on the Logs page, you’ll want to set the timeline to 1 month in the top right corner if the default is set at 15 minutes.
Using the “Search for” Input, the following queries are helpful for finding useful information.
General Async Logs
This will show all logs associated with the transcript ID:
@transcript_id:\<transcript-id\>
This will show what the customer submitted for the specific transcript, including the models used. (You can also do "<transcript-id>" and then search the log that says "Received transcript:"):
"Received transcript:" "<transcript-id>"
Search completed requests for a specific transcript:
*:<transcript-id> request_completed
This will show all recent transcripts received from the customer:
"@account_id: <account-id>" "Received transcript:"
As alternatives:
message:(Received transcript) message:(<account-id>)
Or
<account-id> message:(received transcript)
This will return the true crunch for a specific ID:
@transcript_id:<transcript-id> "crunch"
This will return GET requests for the selected account:
env:production @account_id:<acct id> "request_completed" service:async-speech-api @request.method:GET @request.route:"/v2/transcript/([\^/\]*)"
Search for throttled transcription requests:
env:production "Traffic Shaping" @account_id:<account-id> -@delay:0
Error Logs
This will return the errors associated with a specific ID:
@transcript_id:<transcript-id> "error"
This will return client errors associated with a specific ID:
@transcript_id:<transcript-id> "client failed"
This will return client errors associated with a specific account:
@account_id:<account_id> "client failed"
Useful Log Queries for Streaming
General Streaming Logs
@session_id:<session-id>
The info you can find with this query:
-
The session duration
-
Additional parameters sent such as
terminate_session, andend_utterance_threshold.
This will return streaming logs for an account:
@service:realtime-api @account_id:<account-id>
Streaming Error Logs
This will return all errors for the realtime service:
status:error service:realtime-api
This will return all errors for the realtime service for a specific session ID:
status:error service:realtime-api @session_id:<session-id>
Useful Log Queries for LeMur
This will show logs for when a user exceeds the token limit, including the attempted number of tokens, the token limit and the account ID:
service:lemur-api message:"request over token limit"
Query Tips and Tricks
You can hide unwanted log messages by using the - operator before "message":
-message:"<unwanted-message>"
The following will return only logs for the specific environment, available environments include:
-
production (most commonly used)
-
federal
-
sandbox
env:<environment>
Dashboards
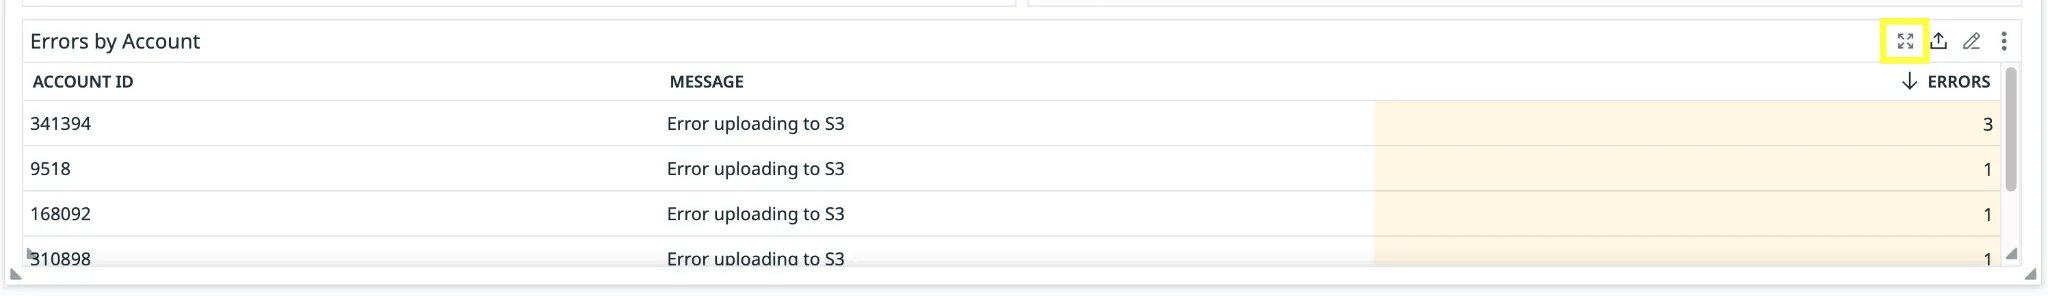
If you would like to create your own dashboard to monitor specific logs or metrics, it’s useful to copy certain widgets that have the info you’d like to track.
To copy a widget, select the share button:
Then select copy:
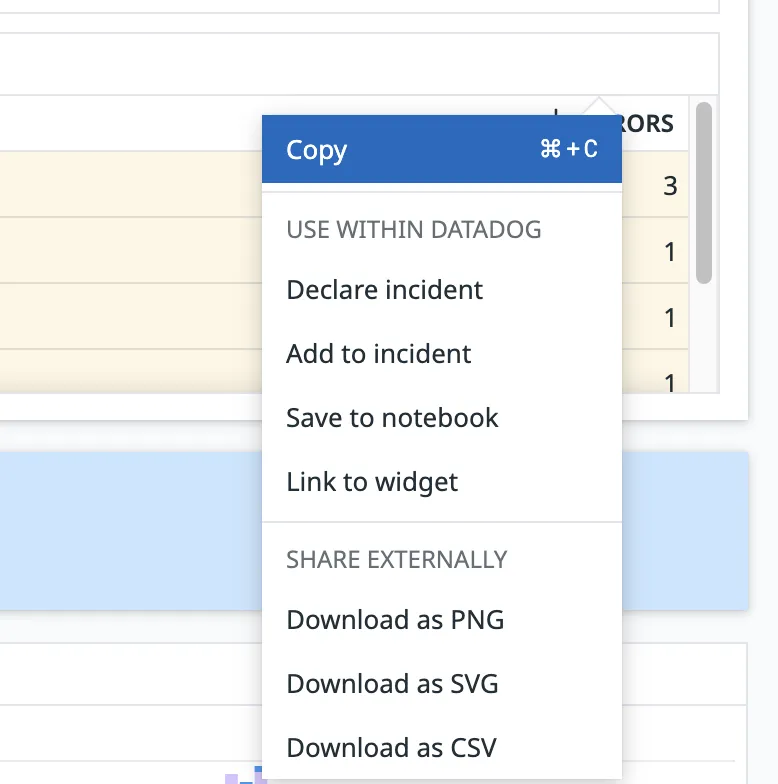
You can then paste this by pressing CTRL + V (or CMD + V for Mac) into your own dashboard.
Useful Widgets To Monitor
Throttling
Async Throttling: datadoghq.com/dashboard/qfx-e6h-xkt/dan-ince-dashboard?fromUser=false&refresh_mode=paused&view=spans&from_ts=1723471688920&to_ts=1723558088920&live=false&tile_focus=5666117922112434 - Track when a user exceeds their concurrency on our async endpoint
Streaming Throttling: datadoghq.com/dashboard/qfx-e6h-xkt/dan-ince-dashboard?fromUser=false&refresh_mode=paused&view=spans&from_ts=1723471813649&to_ts=1723558213649&live=false&tile_focus=794932055204414 - Track when a user exceeds their concurrency for streaming
LeMUR Throttling: datadoghq.com/dashboard/qfx-e6h-xkt/dan-ince-dashboard?fromUser=false&refresh_mode=paused&view=spans&from_ts=1723471871608&to_ts=1723558271608&live=false&tile_focus=6771017686893056 - Track when a user exceeds their rate limits for LeMUR
Errors
Transcriber-Default Errors: datadoghq.com/dashboard/qfx-e6h-xkt/dan-ince-dashboard?fromUser=false&refresh_mode=paused&view=spans&from_ts=1723471933298&to_ts=1723558333298&live=false&tile_focus=540007721007284 - Track errors for our transcriber-default service (rarely needed)
Streaming Errors: datadoghq.com/dashboard/qfx-e6h-xkt/dan-ince-dashboard?fromUser=false&refresh_mode=paused&view=spans&from_ts=1723471933301&to_ts=1723558333301&live=false&tile_focus=1749794036827988 - Track errors for our streaming service
Upload Errors: datadoghq.com/dashboard/qfx-e6h-xkt/dan-ince-dashboard?fromUser=false&refresh_mode=paused&view=spans&from_ts=1723472060780&to_ts=1723558460780&live=false&tile_focus=8976144062060316 - Track errors for our upload endpoint
LeMUR token limit exceeded: datadoghq.com/dashboard/qfx-e6h-xkt/dan-ince-dashboard?fromUser=false&refresh_mode=paused&view=spans&from_ts=1723472060013&to_ts=1723558460013&live=false&tile_focus=3023353772933930 - A widget that implements the token limit exceeded query