
Datadog Smoke Tests Playbook
Introduction
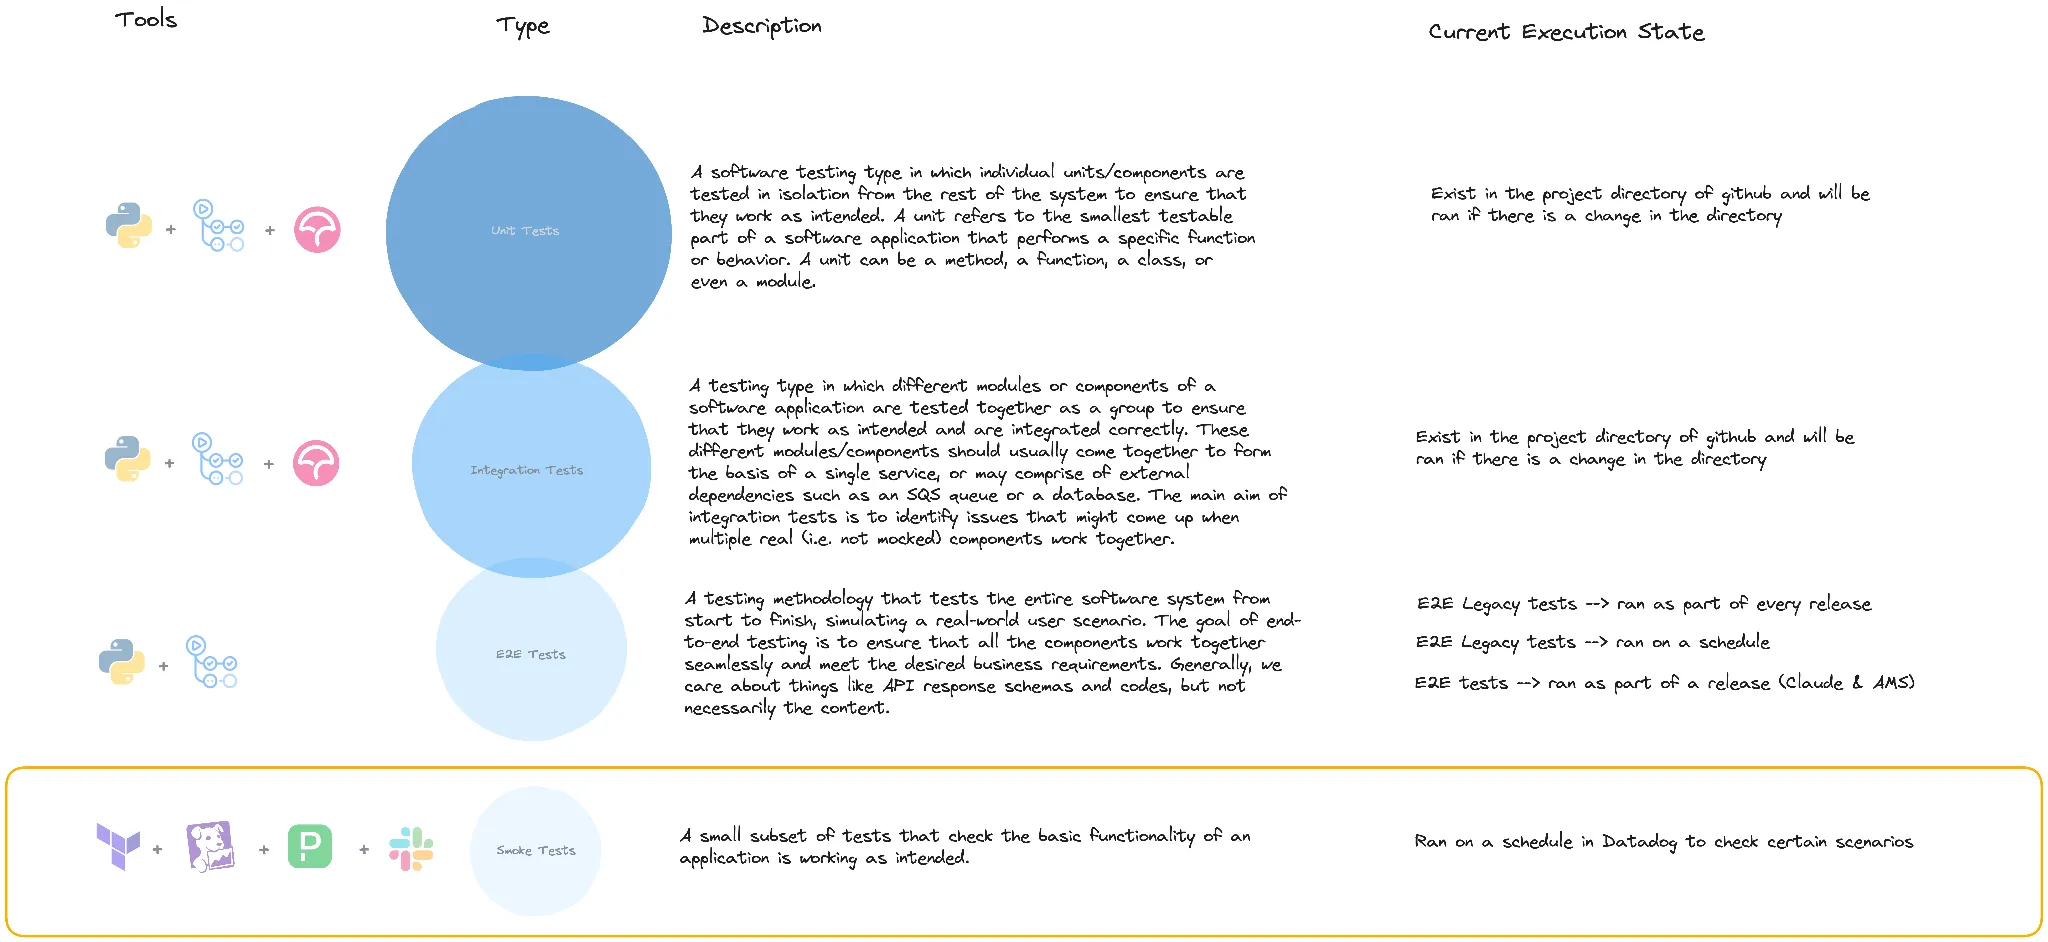
We currently use Datadog to set up synthetic tests that run on a schedule to check that our application and API’s are working as intended, these are named smoke tests.
This playbook intends to cover all necessary procedures for creating, updating and deleting these smoke tests.
Where To Find The Smoke Tests
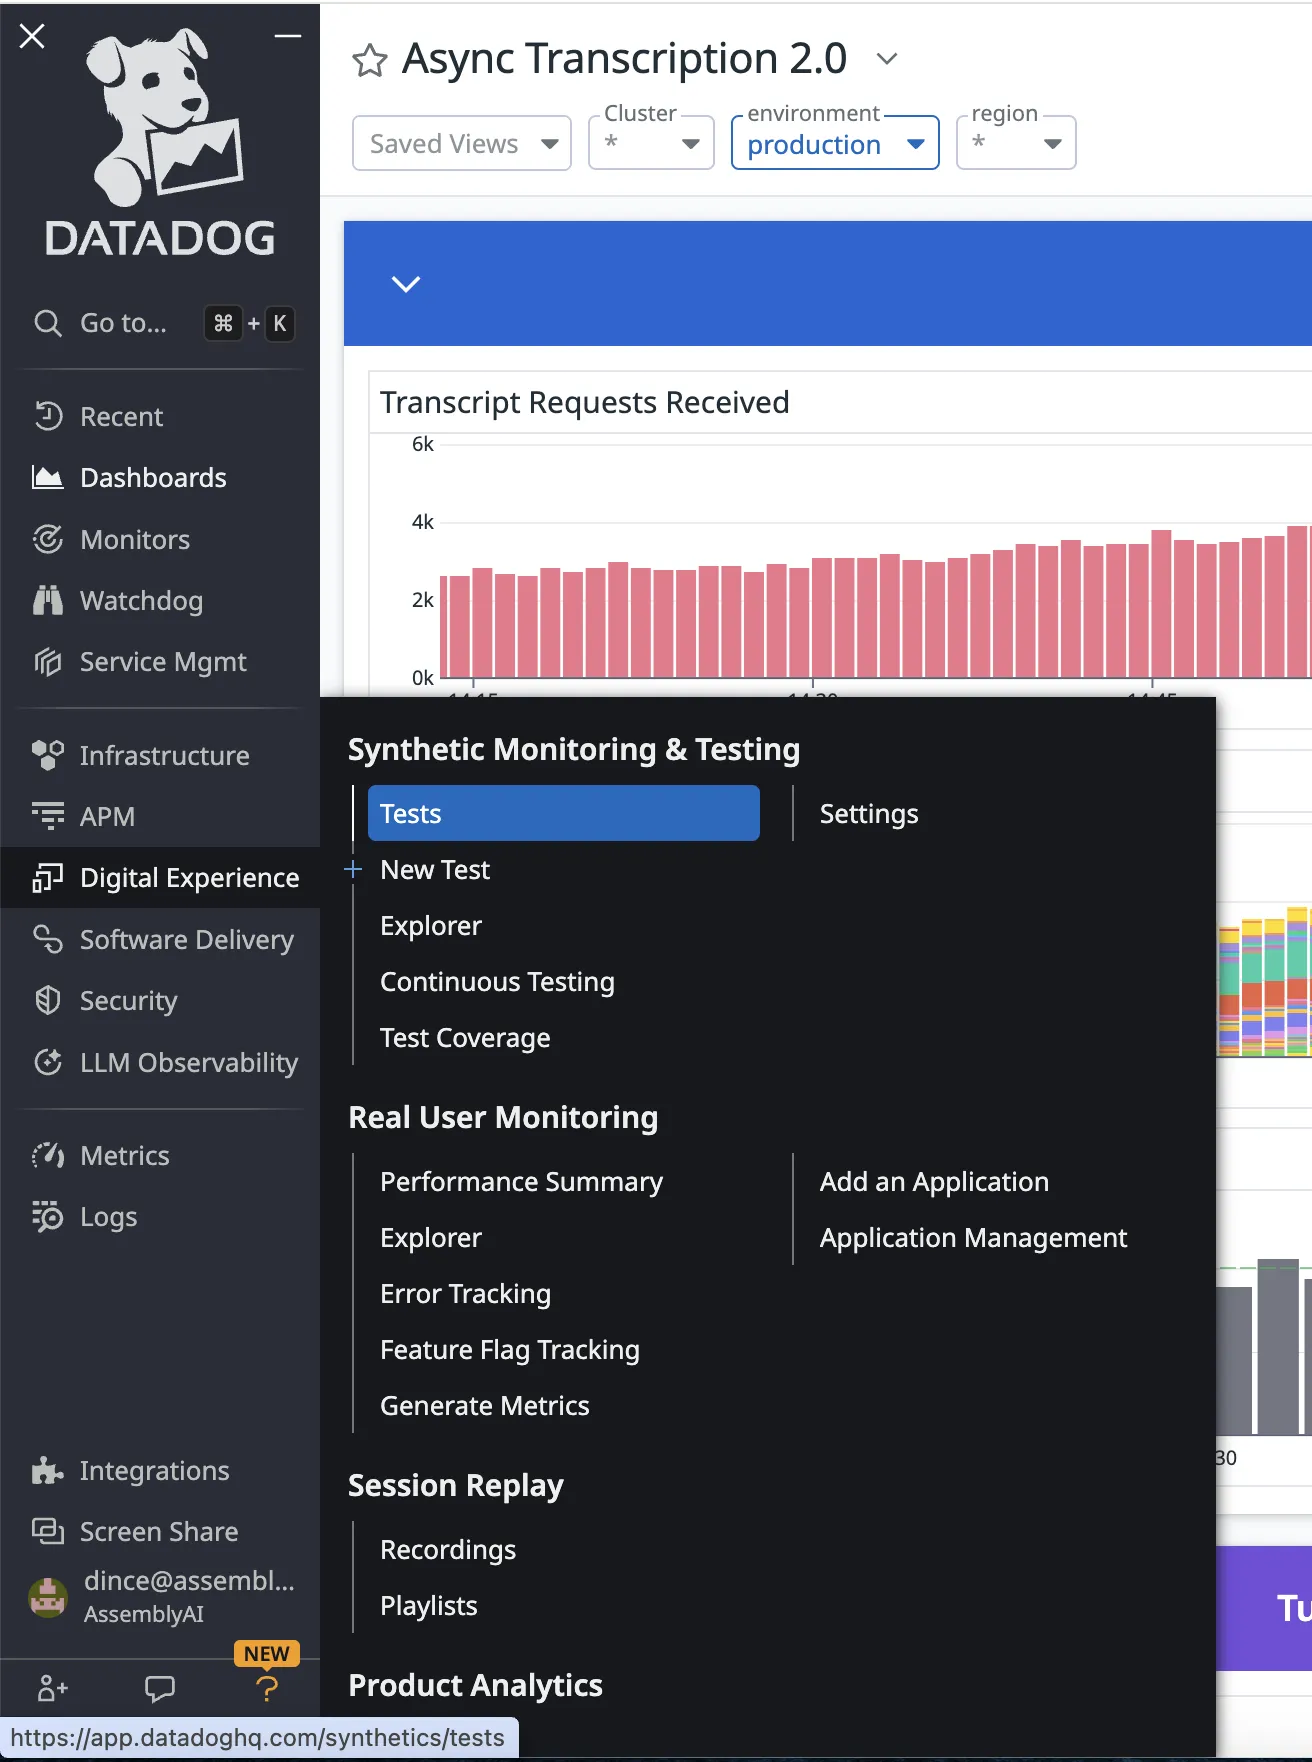
The smoke tests are found in the Datadog dashboard under: Digital Experience > [Synthetic Monitoring & Testing] > Tests
Creating A Smoke Test
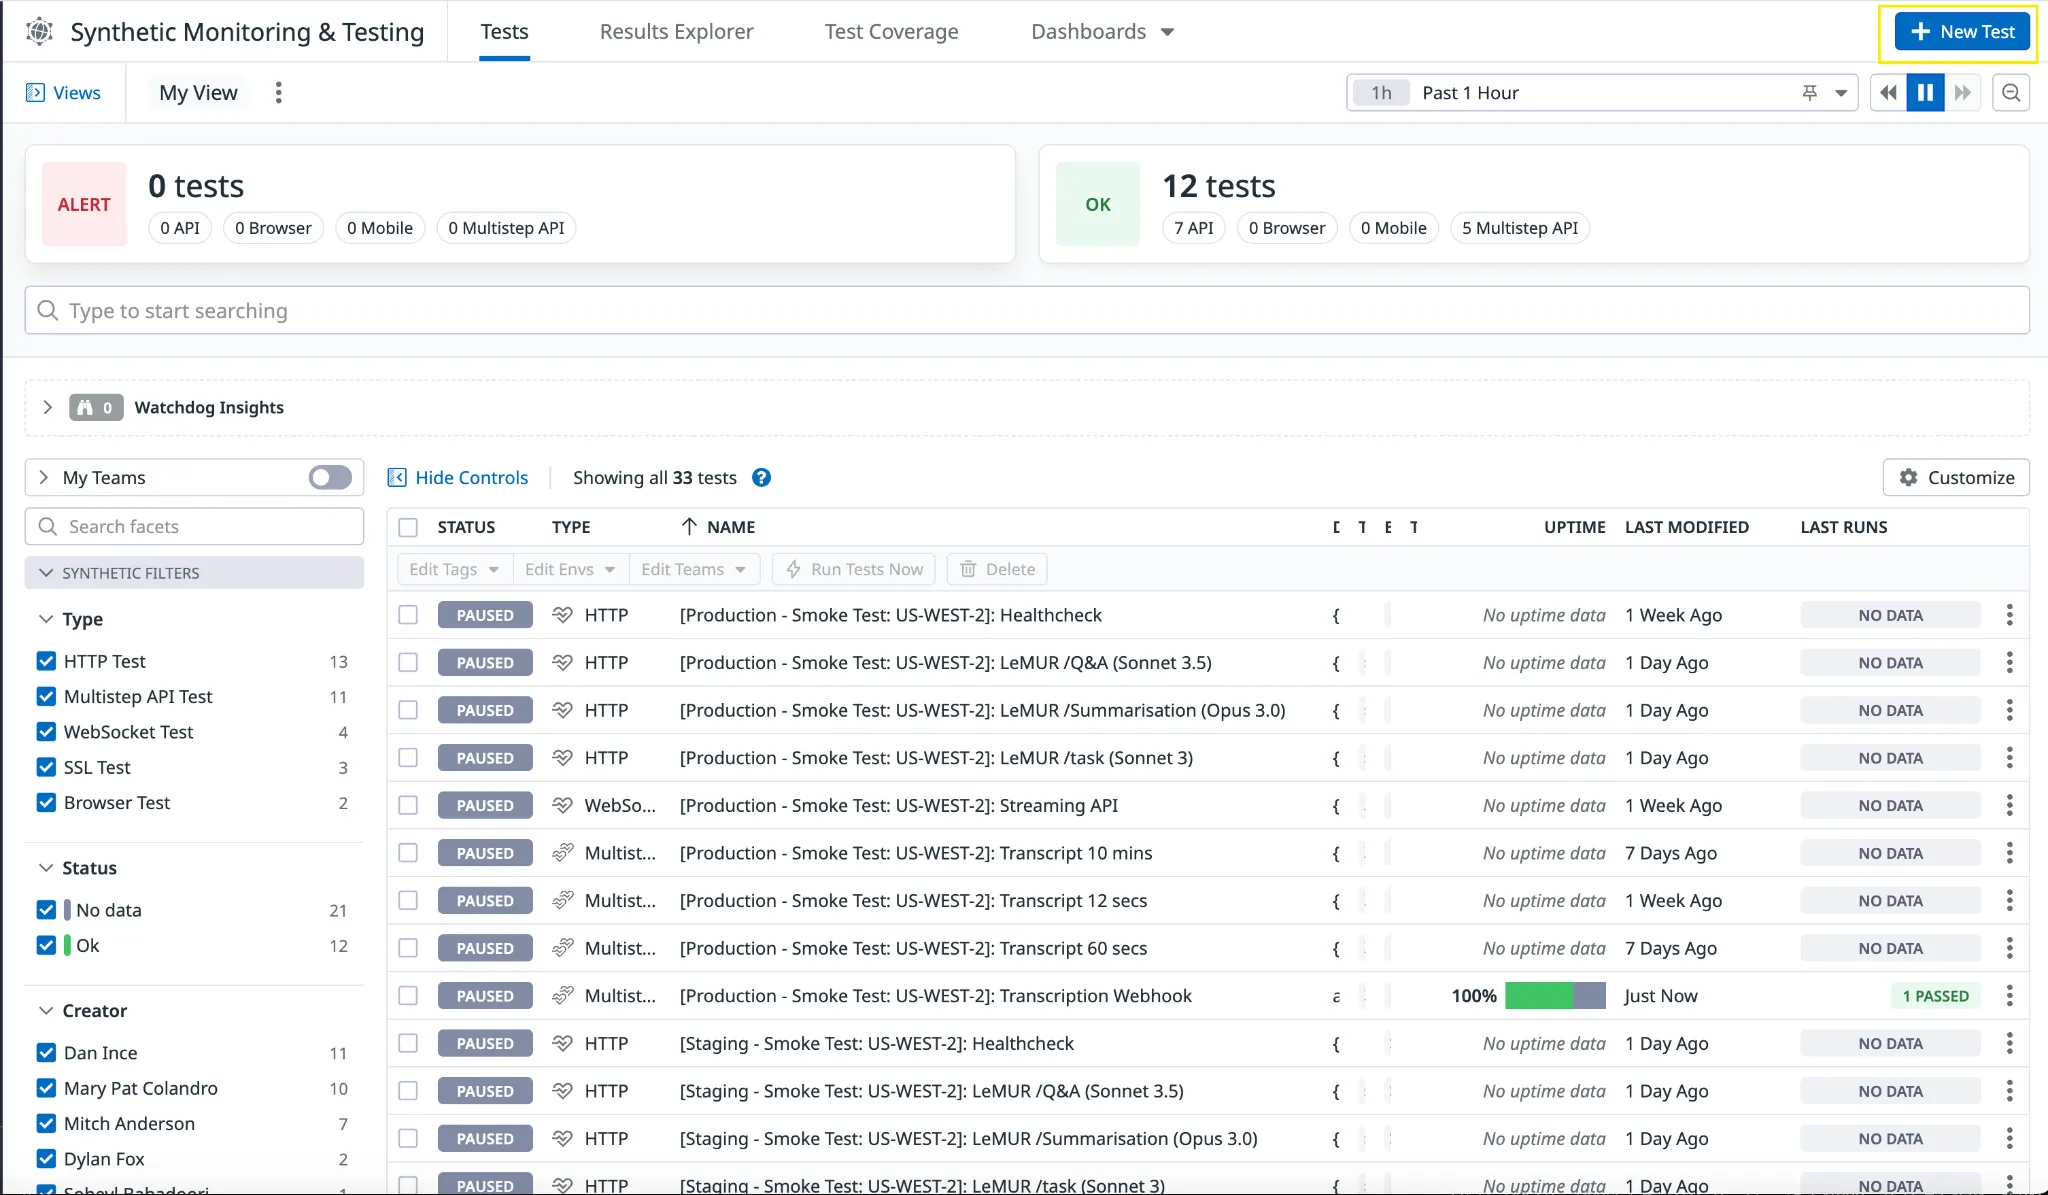
From the synthetic monitoring & testing main dashboard, select ’+ New Test’ in the top right corner.
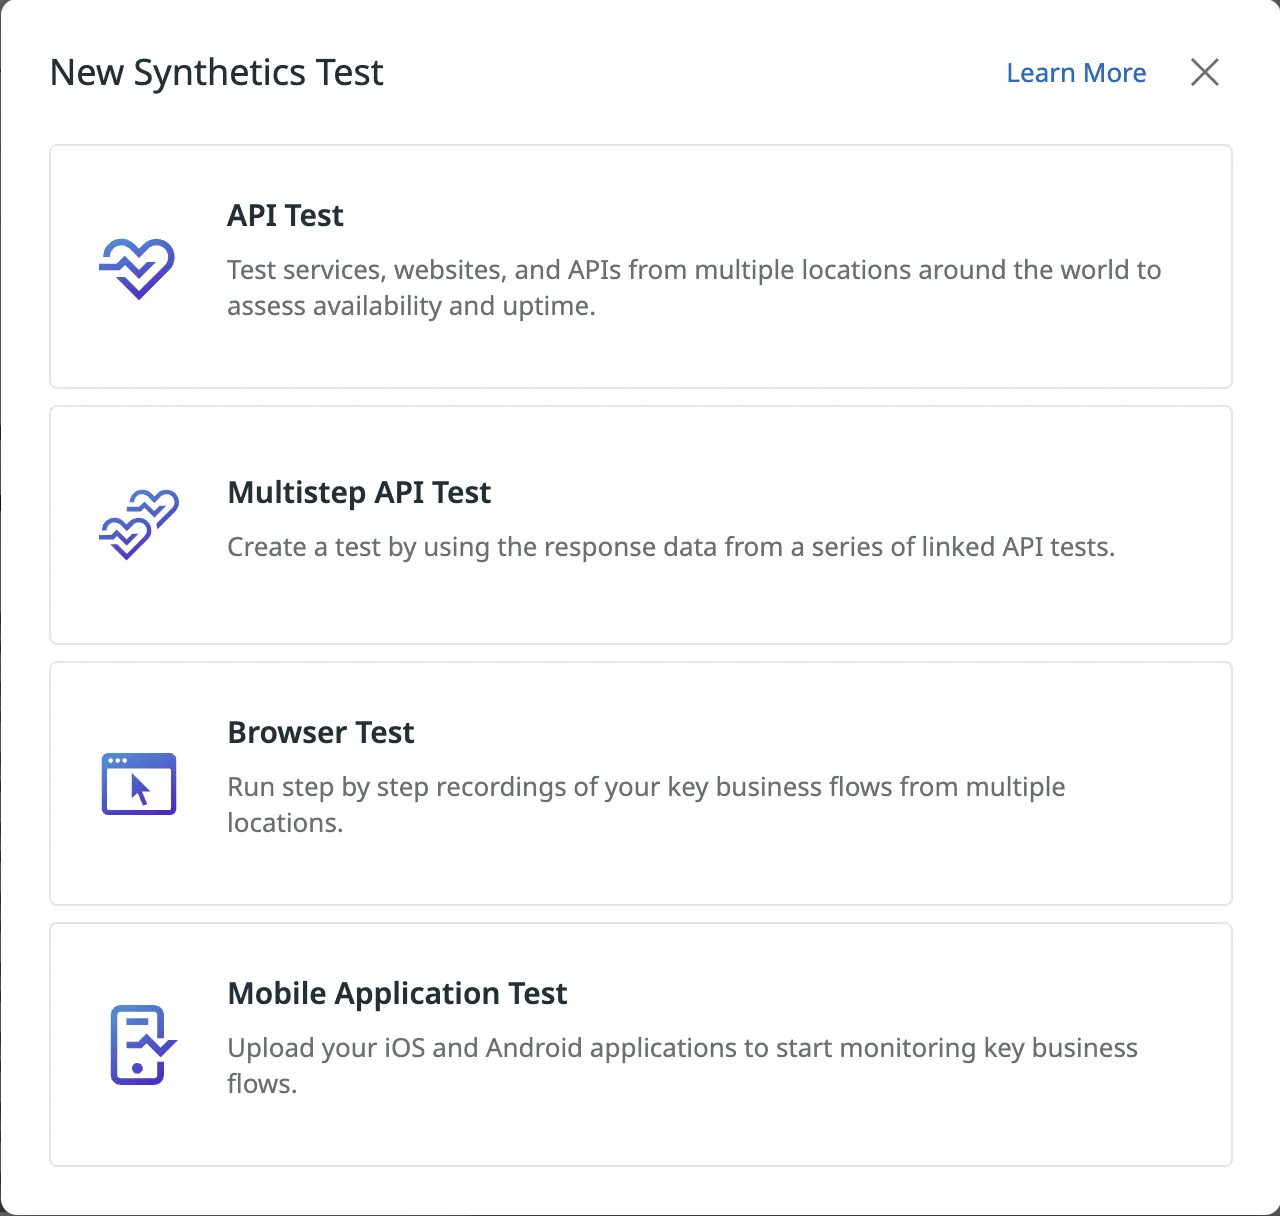
This opens a selection of options for choosing which type of test you want to create:
API Test - a singular API request, used for testing the response.
Multistep API Test - allows you to chain multiple API requests together and test the responses, as well as extracting parameters from responses to be used in the following requests. Useful for testing workflows such as POST (extract ID) -> GET by ID -> DELETE by ID.
Browser Test - create step-by-step recordings from your browser that turn into repeatable tests. Useful for testing workflows such as user sign-in on our dashboard.
Mobile Application Test - not used.
API Test
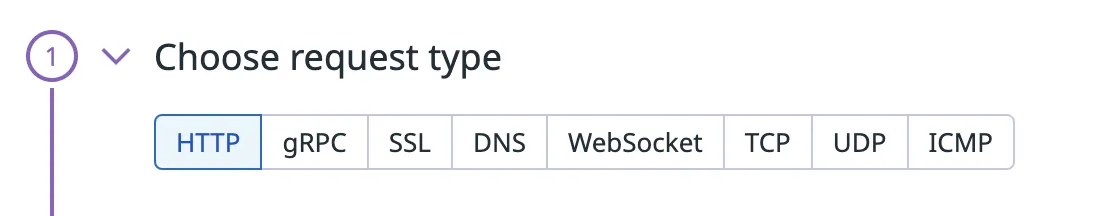
- Select your request type
- Define the request
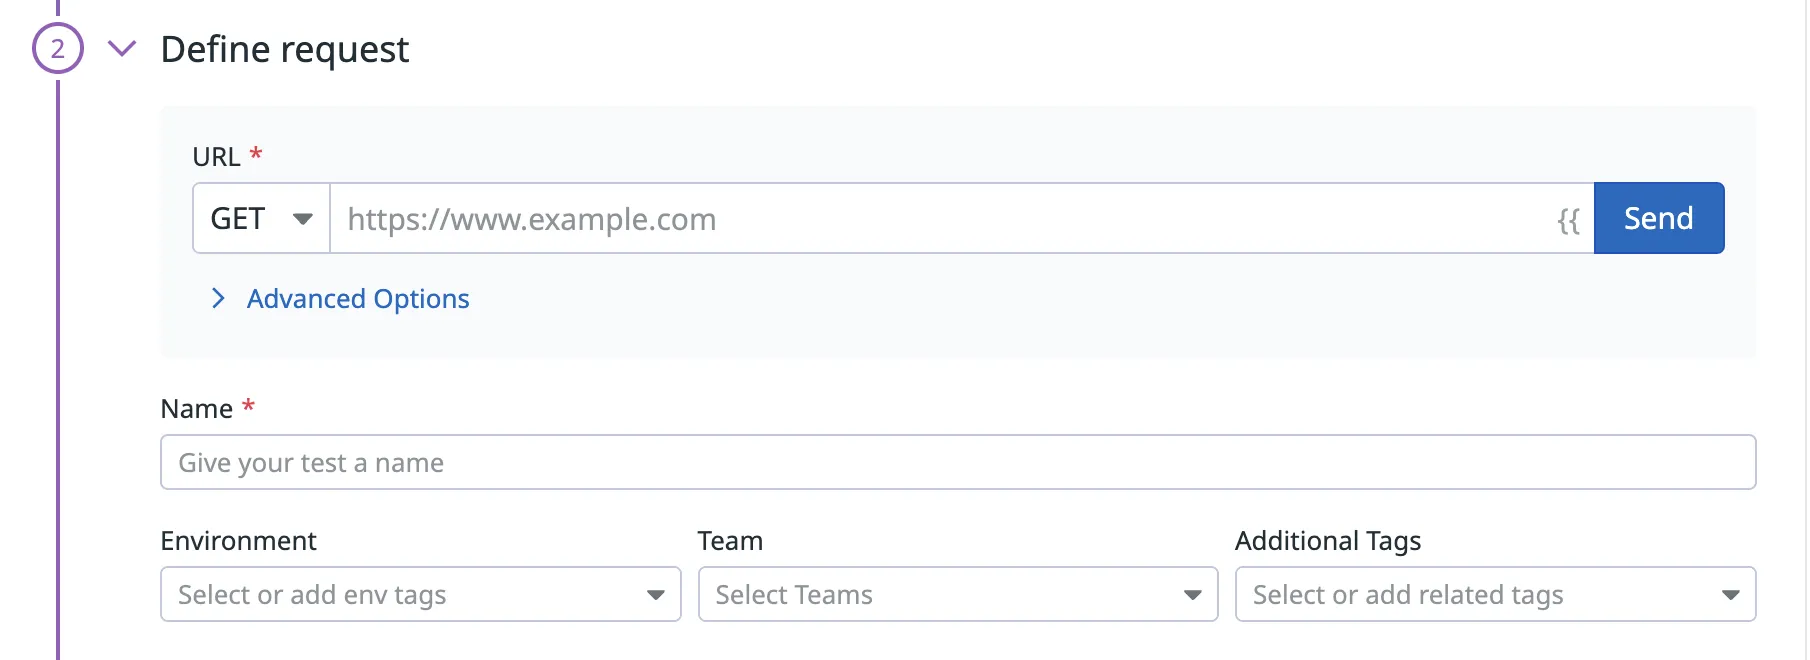
In this step you define the request by selecting which type of request, set the URL, set the name of the test itself and add tags.
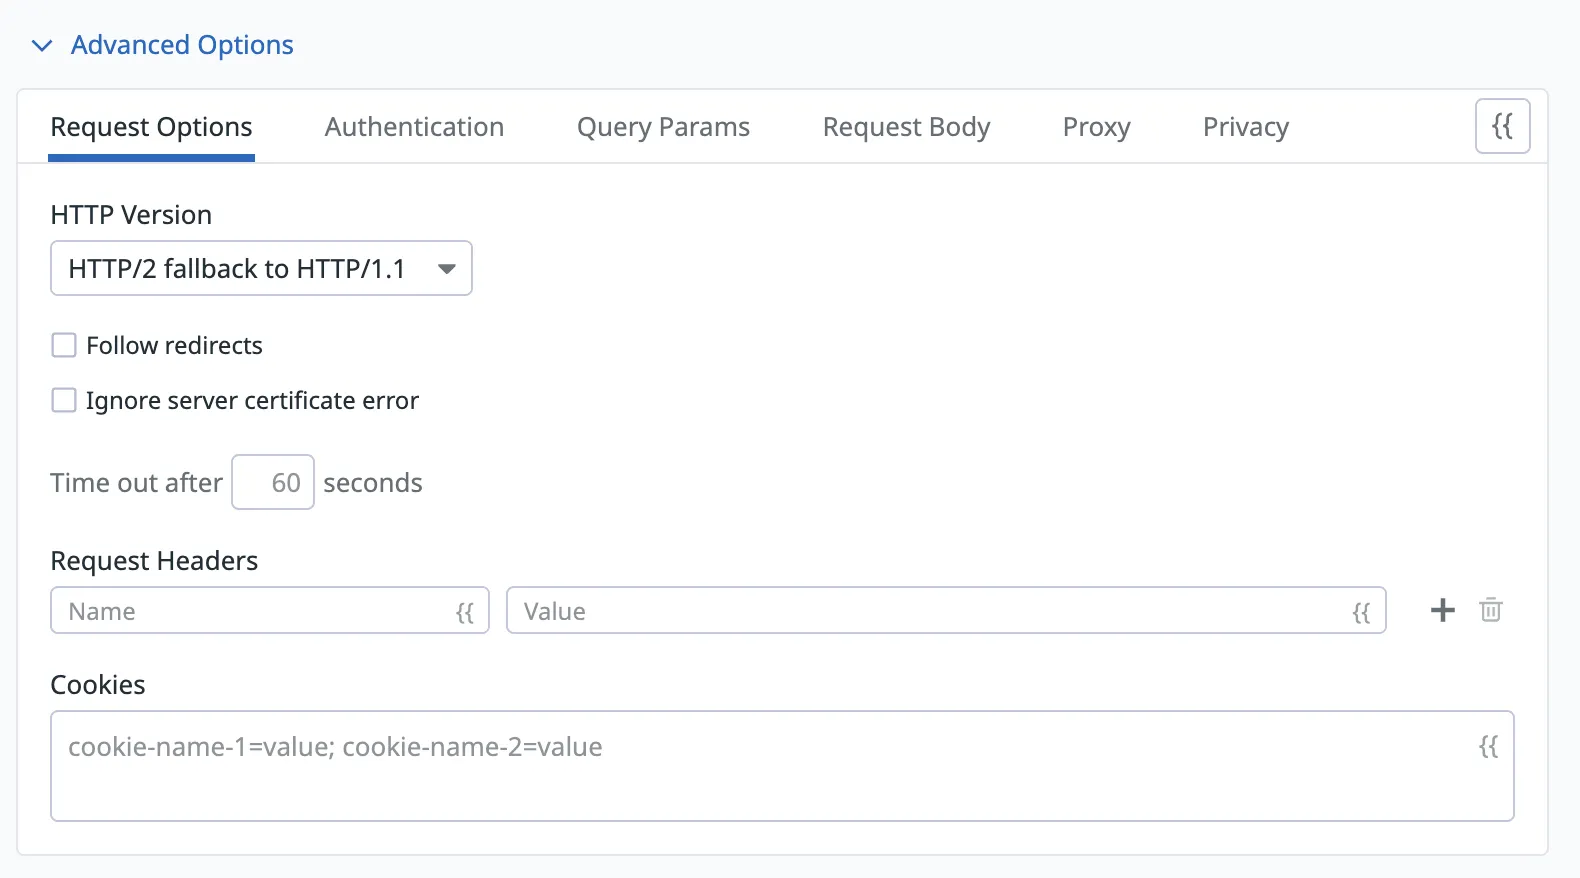
You can also set the headers, authentication and request body in the advanced options.
- Define assertions
In this step you define what you would like the result of the test to be, for it to be successful.
Tip: If you press ‘Send’ from Step 2 after configuring your request, an example assertion from the request will be automatically set which is a good basis to work from initially.

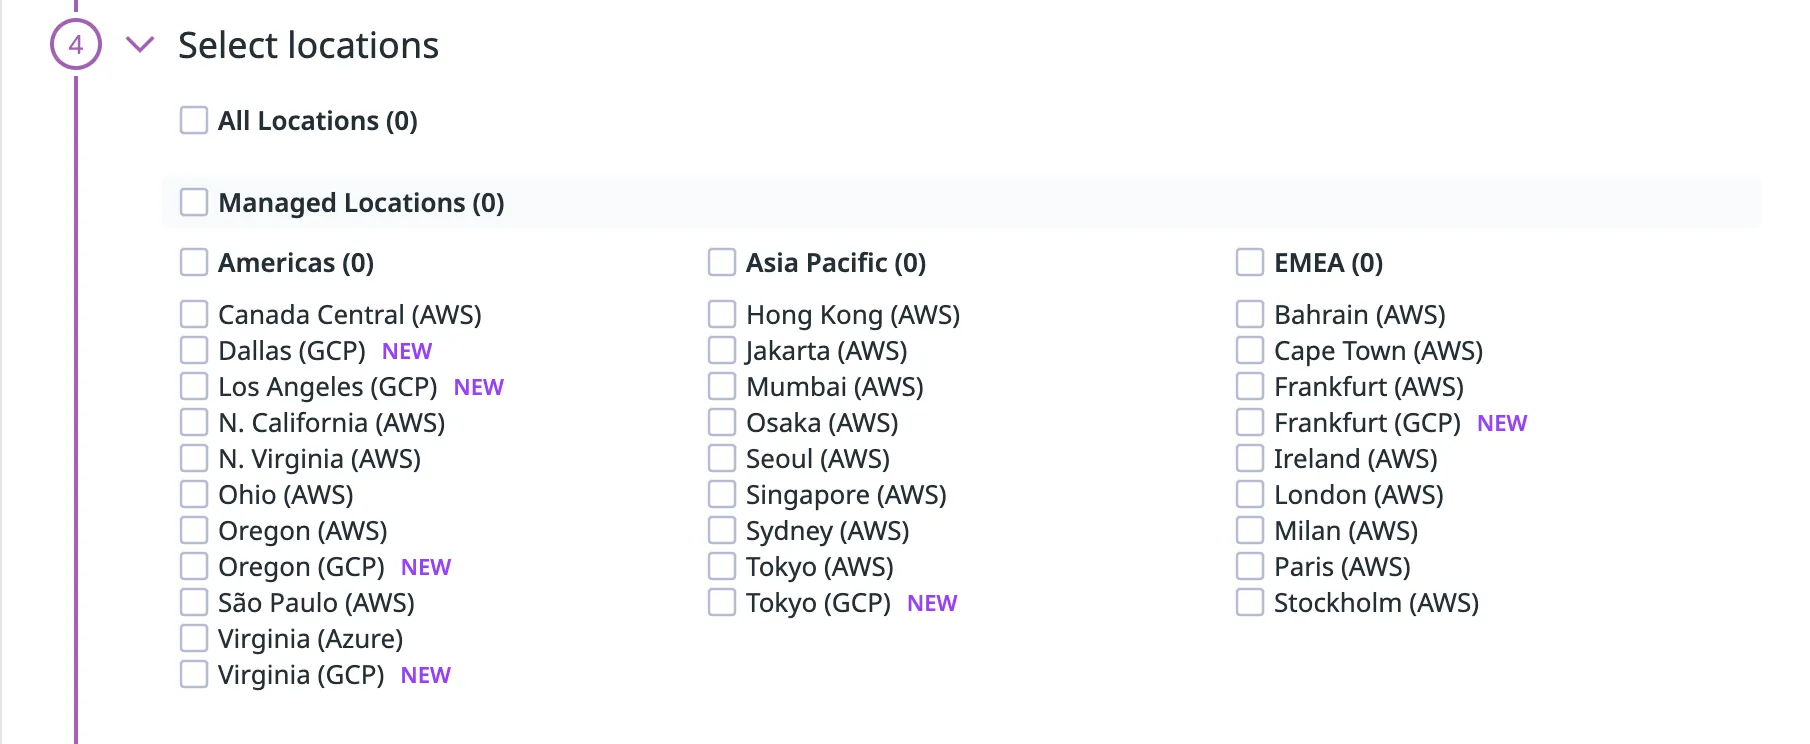
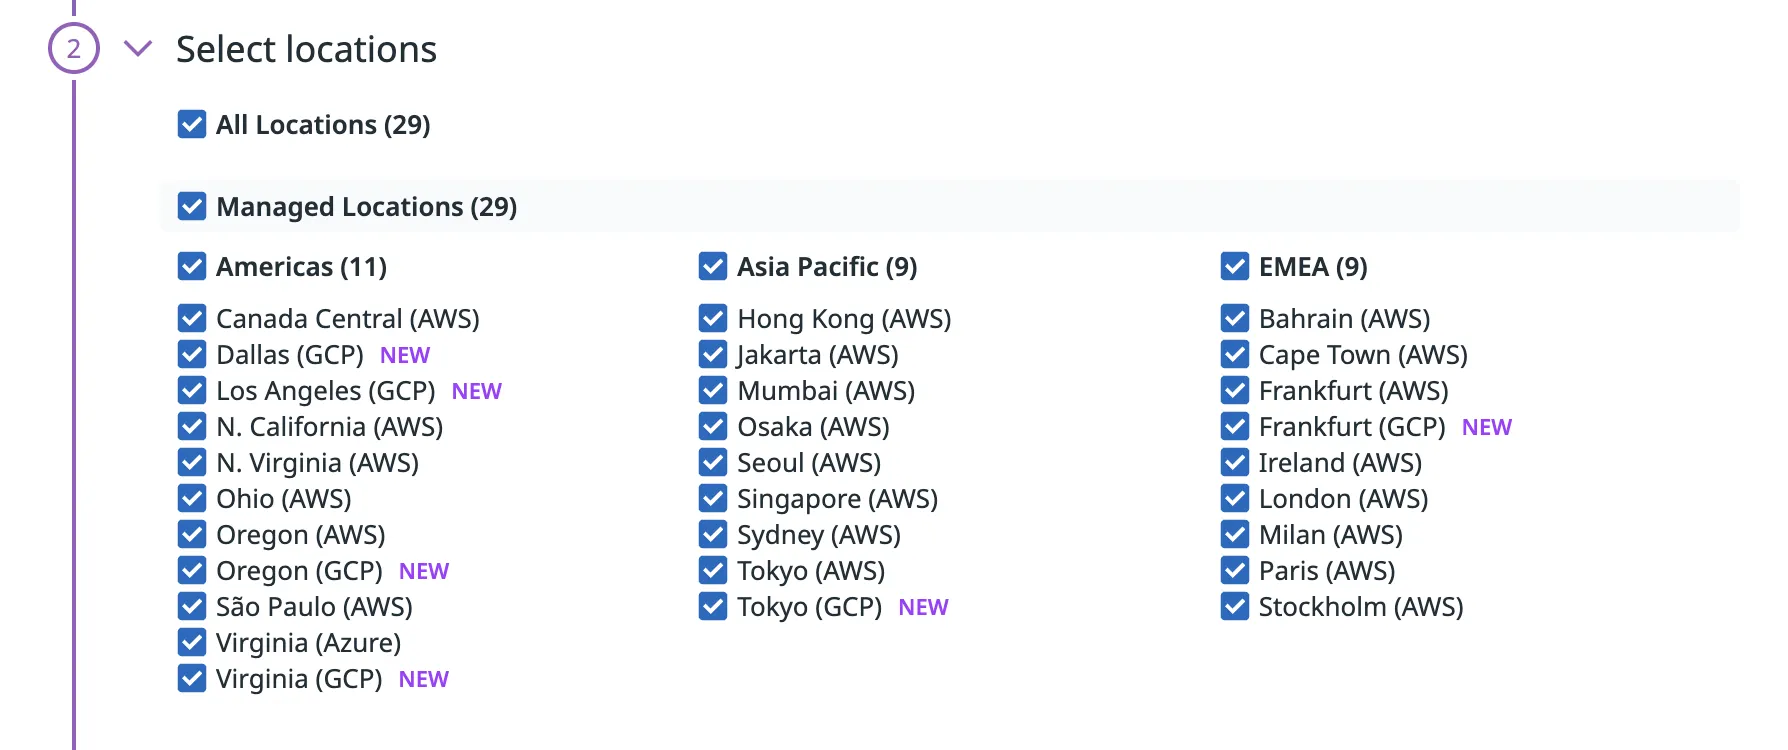
- Select location/s
Select the locations you would like the test to be run from, typically we only run tests from Oregon (AWS). Some tests may be required to be run from multiple locations (Engineering would let us know where to select, if this is the case).
- Define retry conditions
Select the conditions of a retry, involving the number of retries and the wait between failures.
Prod: retry test 2 times with 20,000ms of wait between failures.
Staging: retry test 2 times with 30,0000ms of wait between failures.

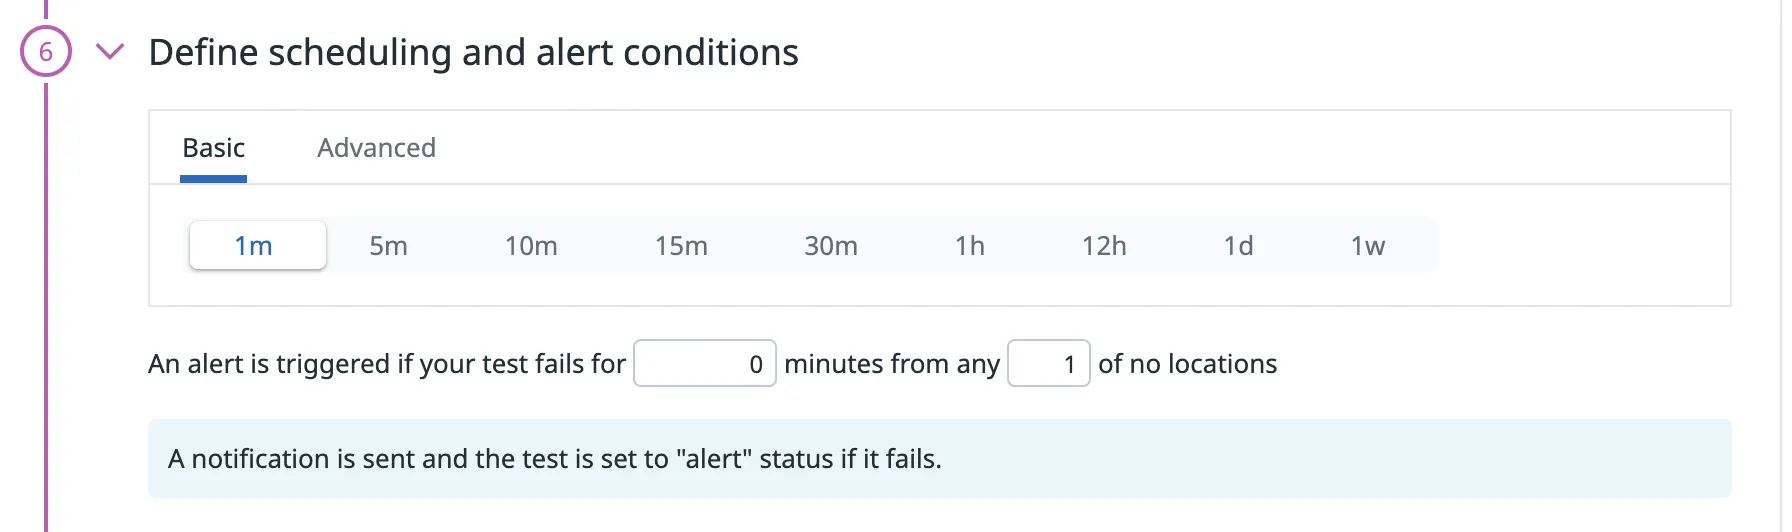
- Define scheduling and alert conditions
Define the cadence you would like the test to be run on.
Schedule:
Prod: every 5m
Staging: every 30m
Alert:
Prod: if the test fails for 10m
Staging: if the test fails for 30m
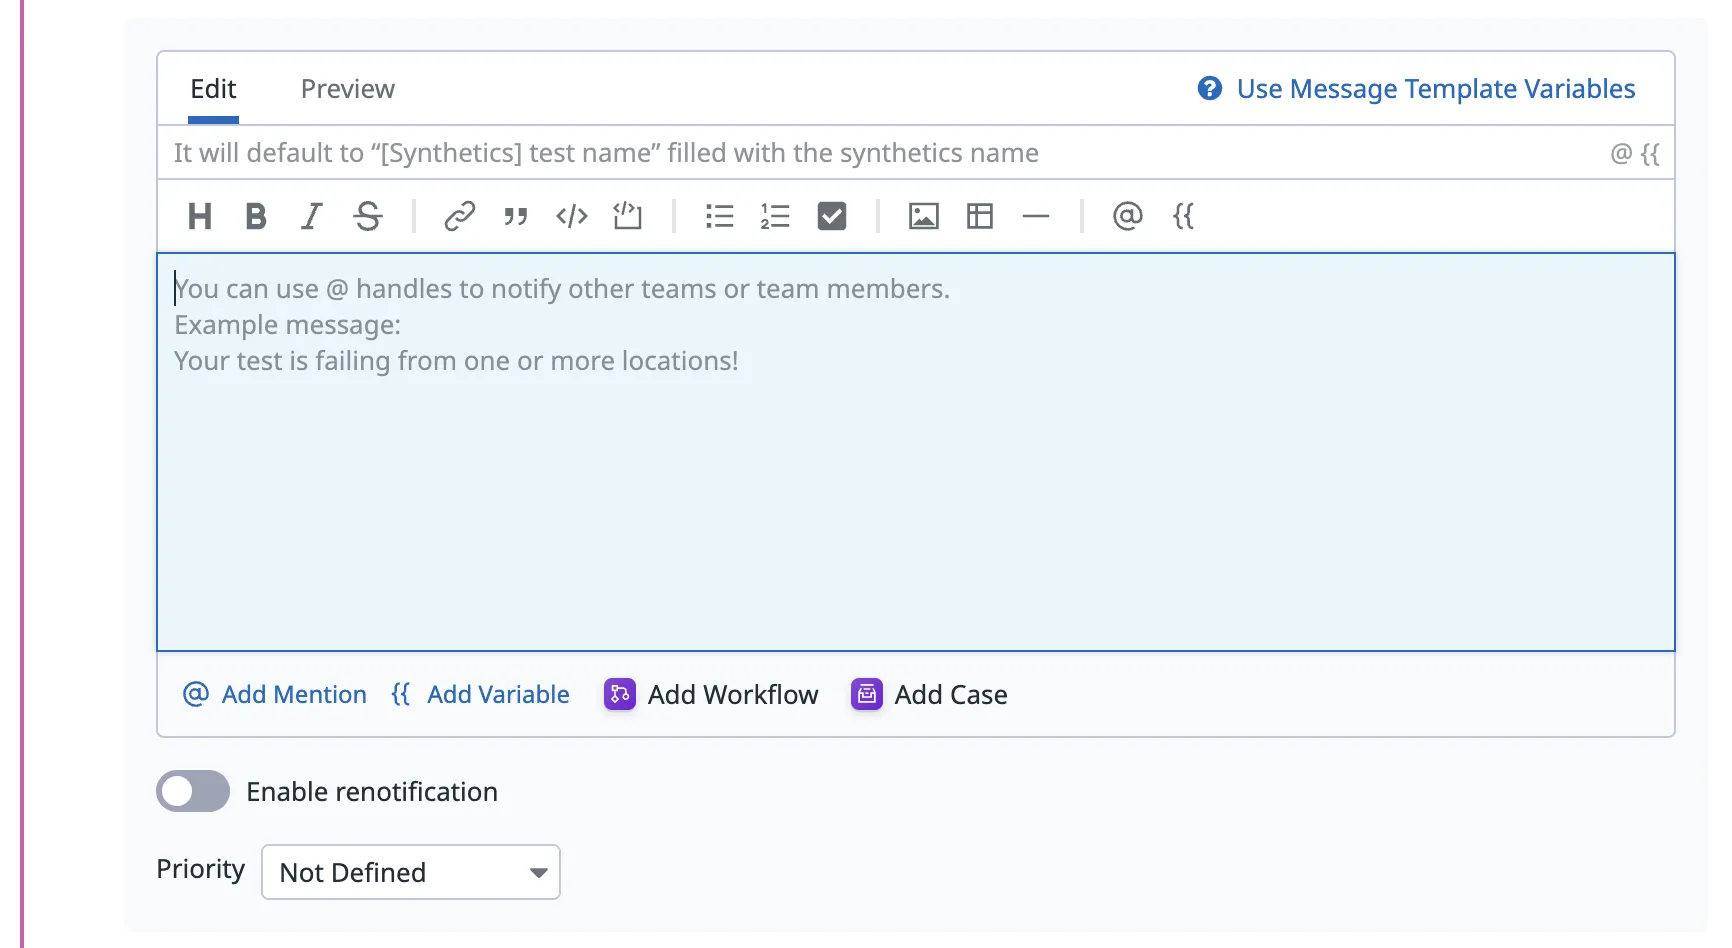
- Configure the monitor for this test
In this section, you configure the message to be sent when an alert is triggered.
P1
Messages to be sent to Slack and PagerDuty
{{#is_alert}} API Test has failed for over XX minutes @pagerduty-AssemblyAI {{/is_alert}}
{{#is_recovery}} @pagerduty-resolve {{/is_recovery}}
@slack-AssemblyAI-smoke-tests
P2+
Messages to be sent to Slack only
{{#is_alert}} API Test has failed for over XX minutes {{/is_alert}}
{{#is_recovery}} {{/is_recovery}}
@slack-AssemblyAI-smoke-tests
Your API test is now complete!
Multistep API Test
- Name and tag the test

- Select location/s
Select the locations you would like the test to be run from, typically we only run tests from Oregon (AWS). Some tests may be required to be ran from multiple locations (Engineering would let us know where to select, if this is the case)
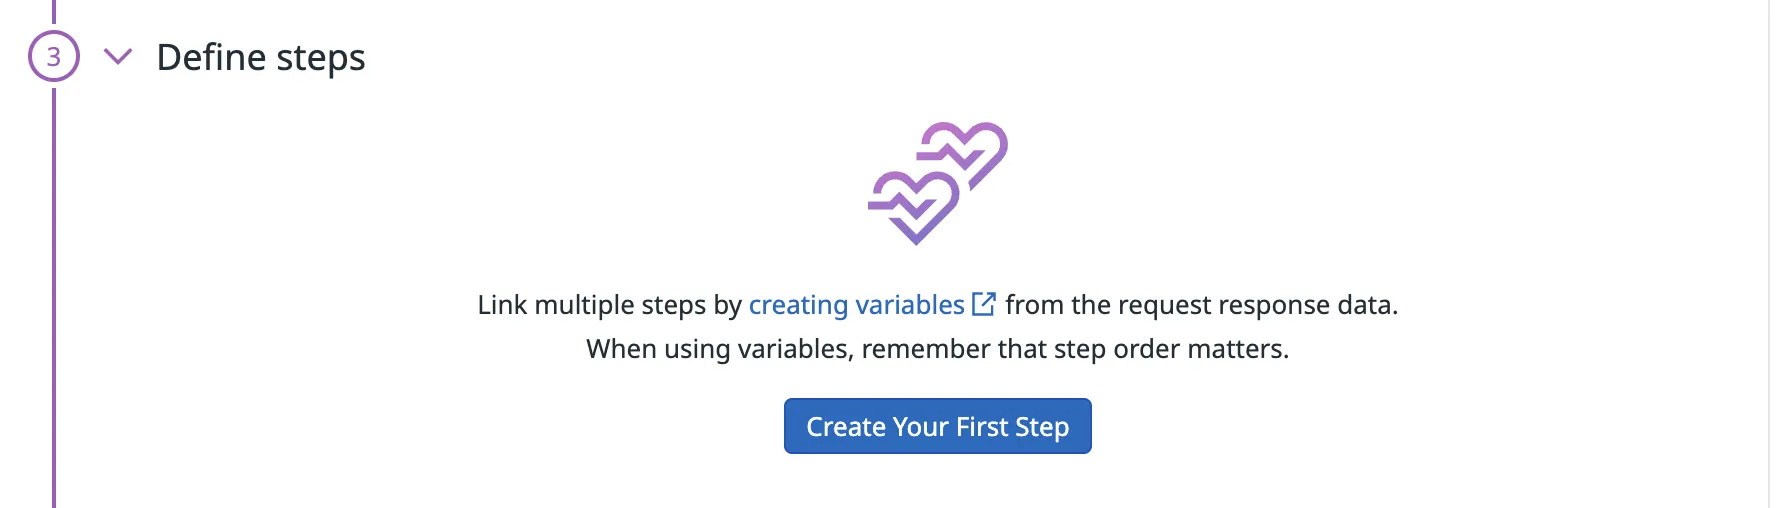
- Define steps
From here, you create the request steps to build the workflow you would like to achieve.
This is similar to creating individual API tests, with the added functionality of being able to extract variables from each step to be used in future requests. For example, first submitting an audio file to the /upload endpoint and then extracting the resultant audio URL.
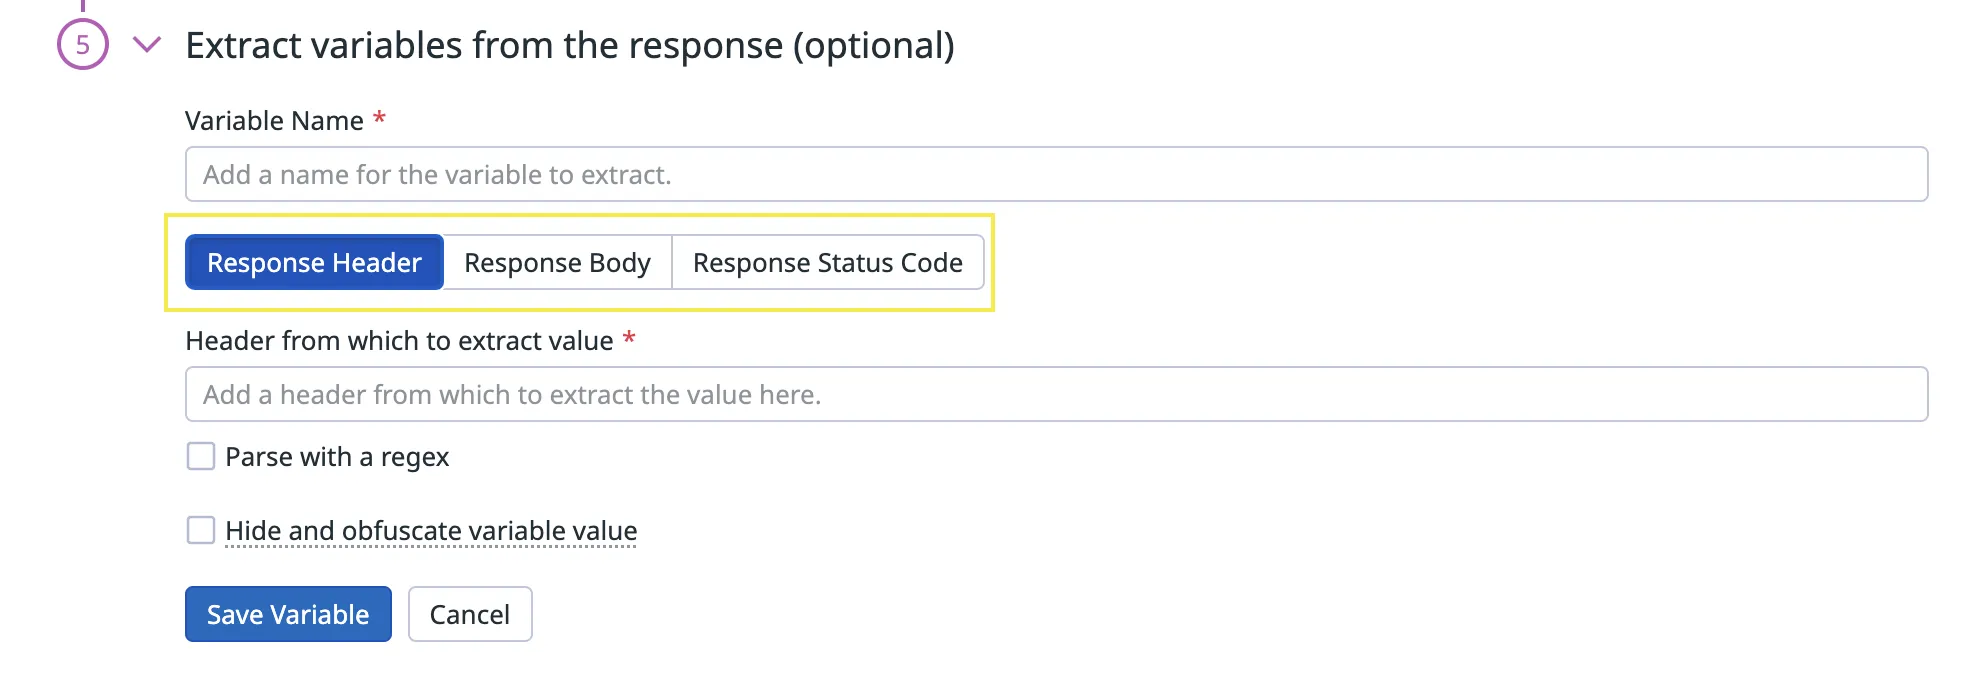
To extract a variable, first select the location of where the value is stored: Response Header / Response Body / Response Status Code and parse the value as instructed.

- Complete the retry conditions, scheduling and alerts, configure the monitor and set permissions as outlined in the API test steps.
Your multistep API test is now complete!
Browser Test
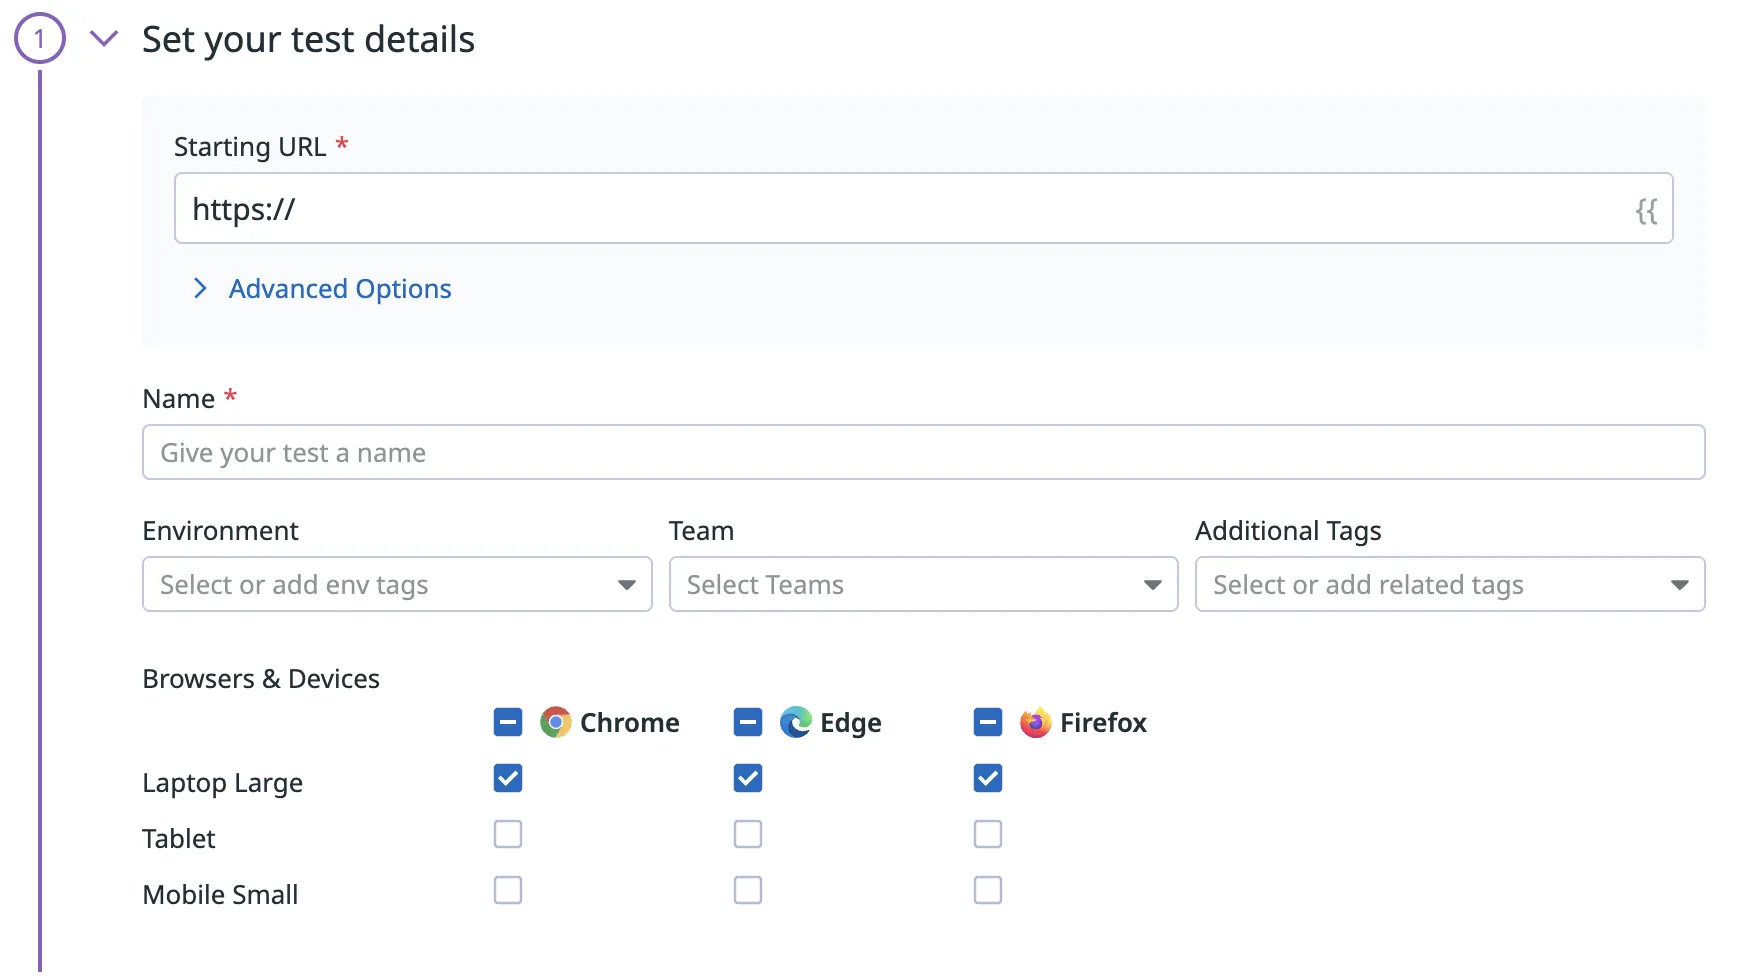
- Set your test details
Here you’ll want to set the starting URL of where the browser test should originate from.
-
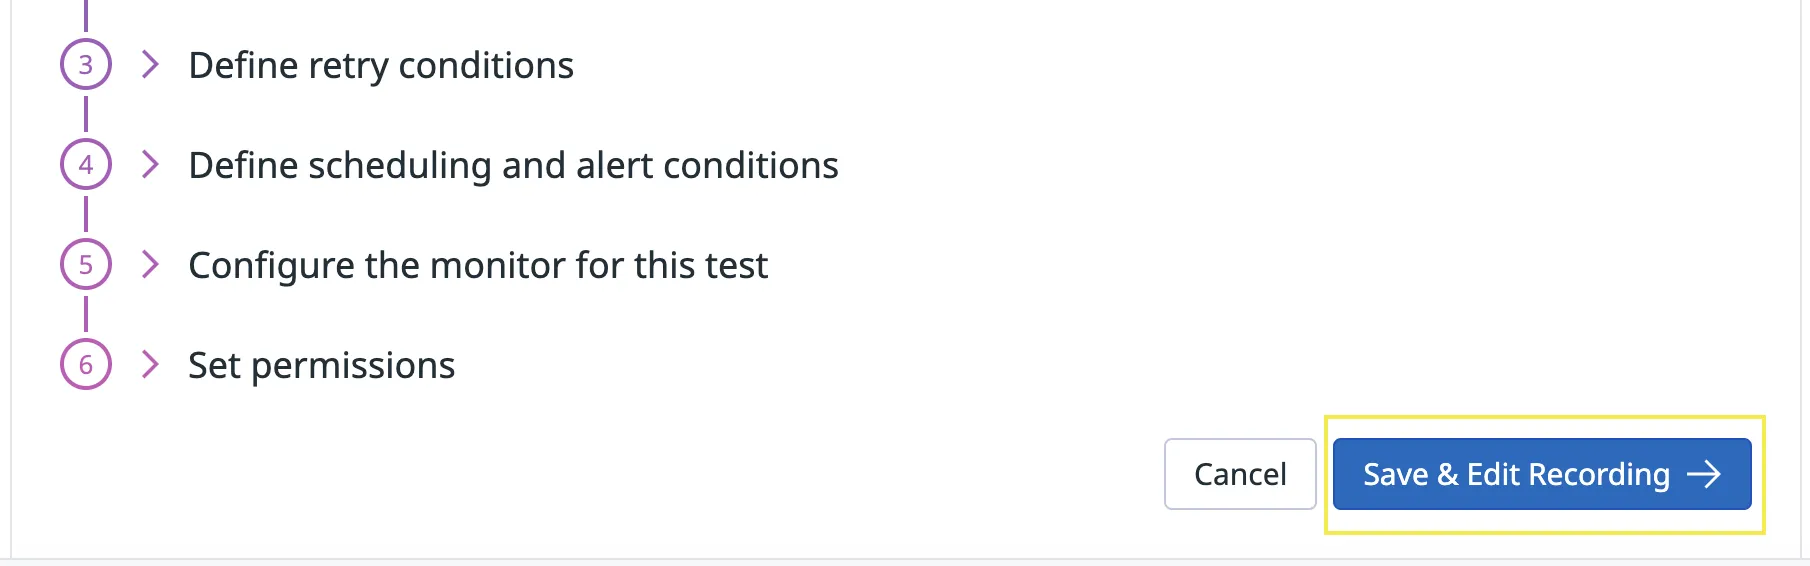
Configure the locations, retry conditions, scheduling and alerts, monitor and permissions as outlined in the API test step.
-
Select Save & Edit Recording to continue to the recording step.
-
DataDog will prompt you to install the Datadog test recorder chrome extension, download this.(link)
-
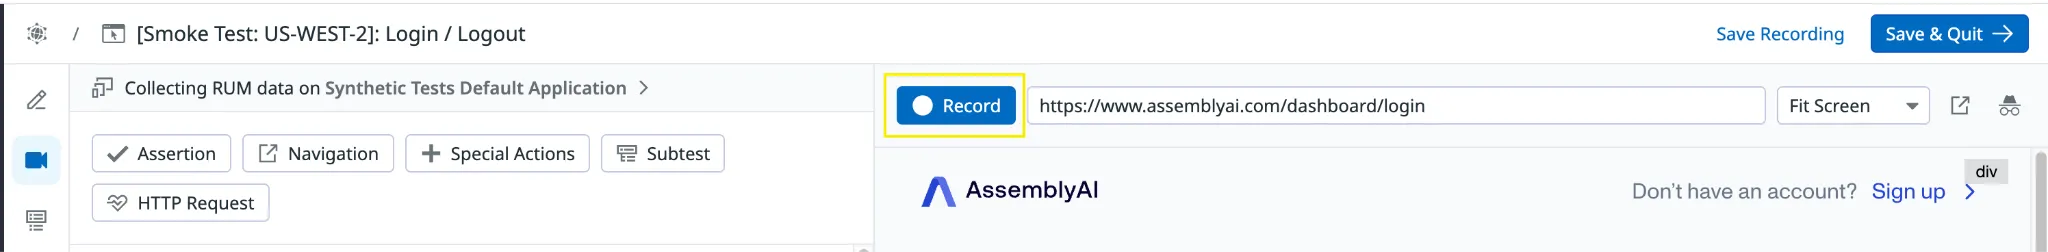
Click Record to begin recording your test steps.
You can start navigating and inputting values such as login details, and DataDog will record each step. After completion, select Stop Recording.
- Review the test steps and edit them as necessary.
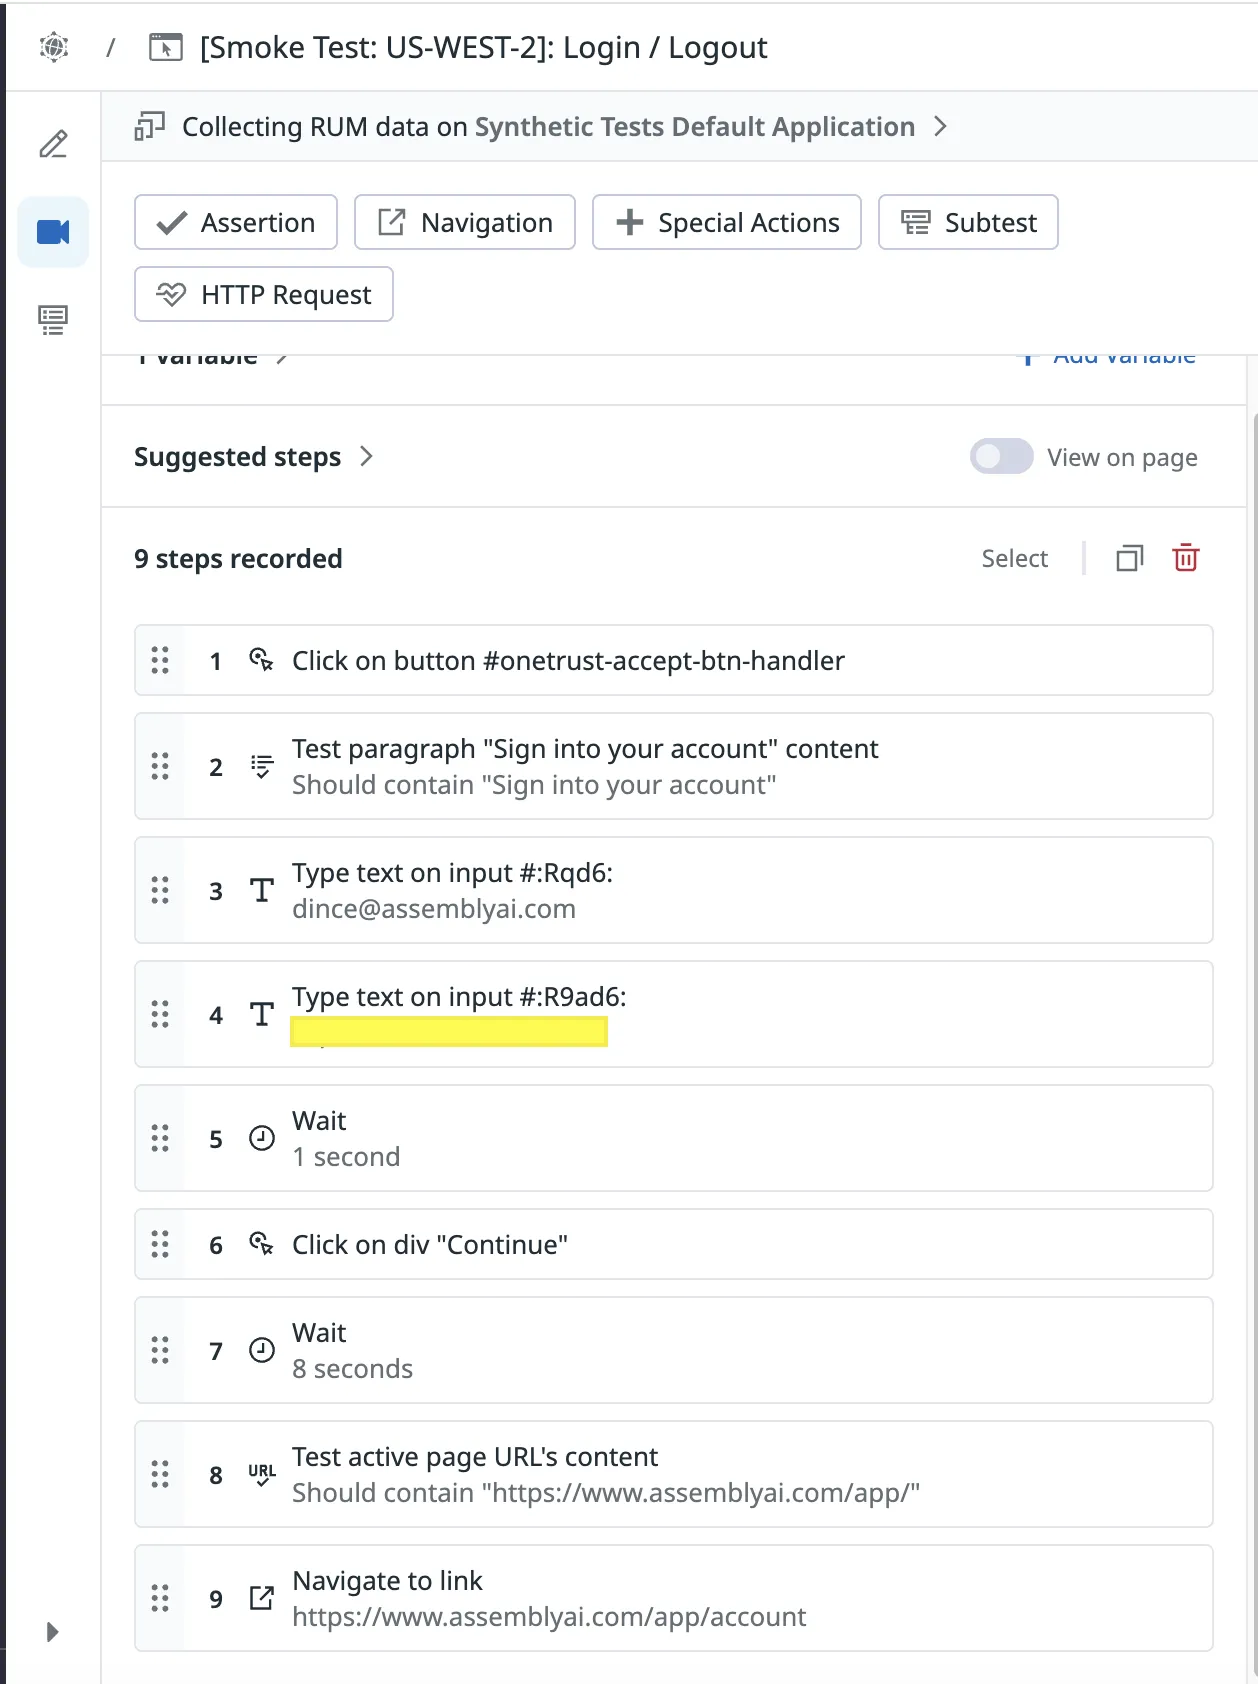
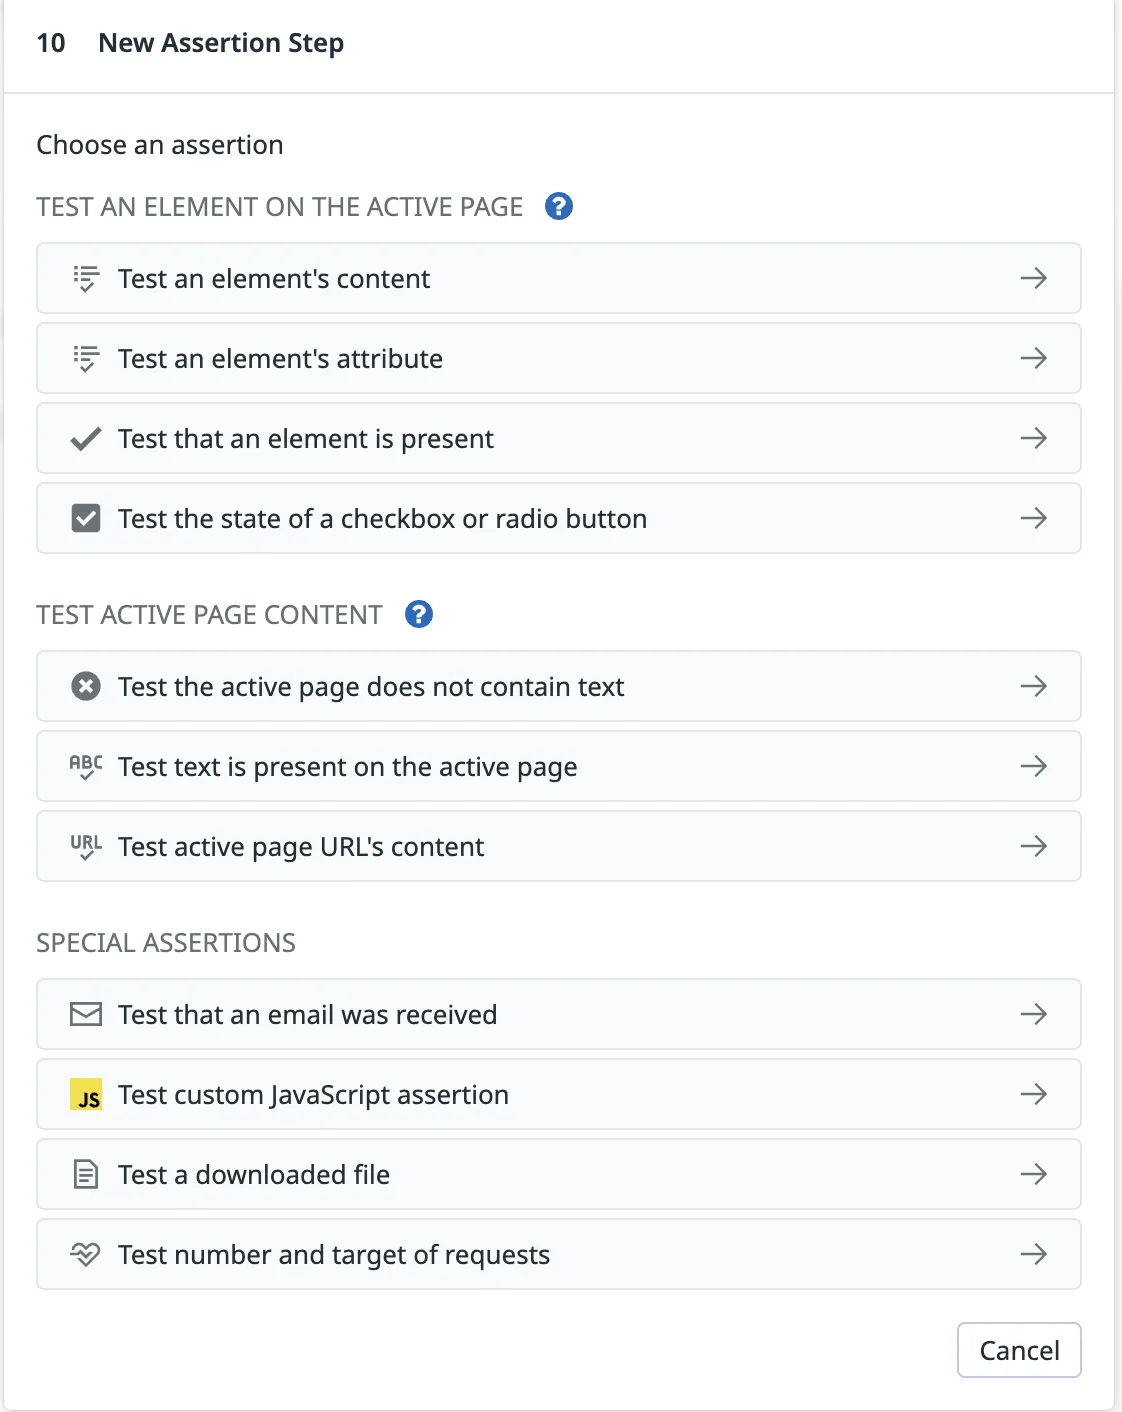
- To complete the browser test, add an assertion. This ensures that the test resulted in the expected state. If there are multiple states that need to be tested, for example in the above test we want to ensure the ‘Sign into your account’ button is visible on the home screen as well as that the page is redirected to the app (Page URL should contain https://assemblyai.com/app/’) after the login, add an assertion for each state.
- Select Save & Quit
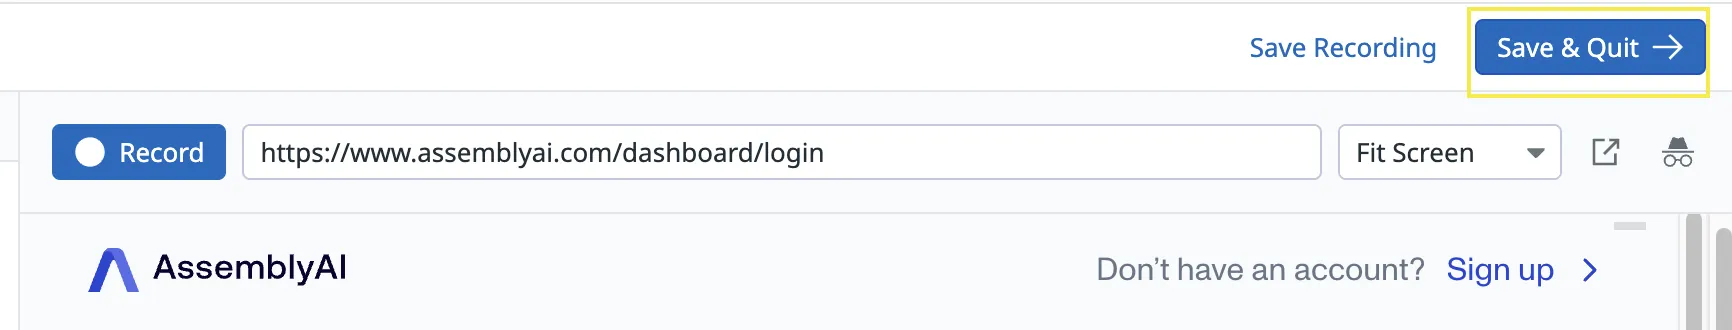
Your browser test is now complete!
Viewing/Troubleshooting The Results
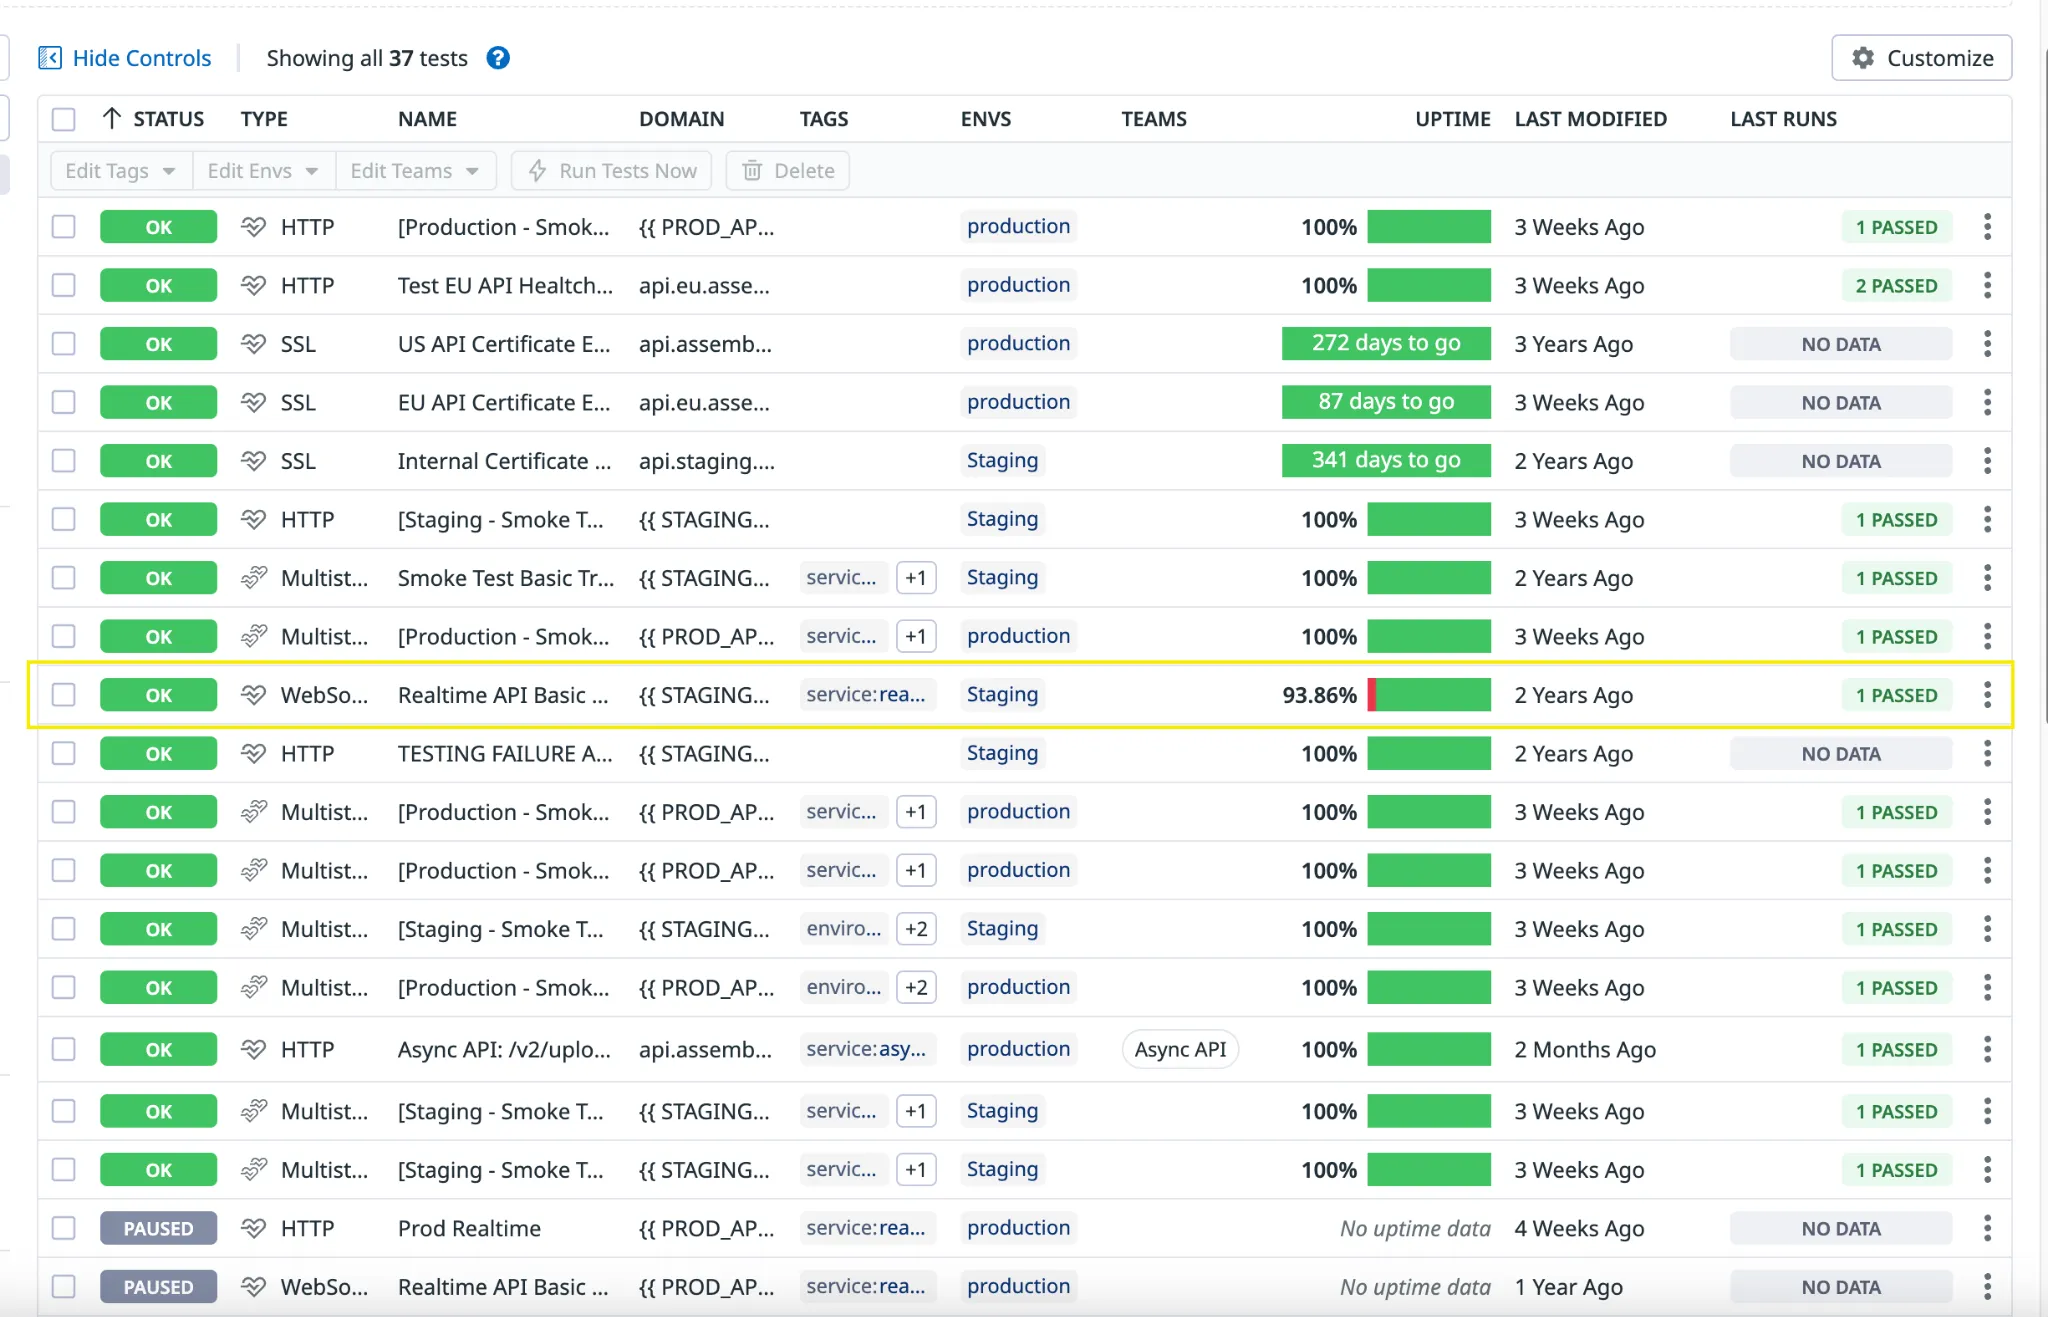
To view the results for a test, click on the test from the homepage. As an example, we will walk through how to troubleshoot a test and read the result:
In the following screenshot, the highlighted test has a 93.86% uptime, which indicates that the test has failed 6.14% of the time. Click on the name.
From the test results page, we can see an overview of the configuration.
You can select the Run Test Now button to manually run the test.
You can select the Pause Scheduling button to pause the test from running on its configured schedule.
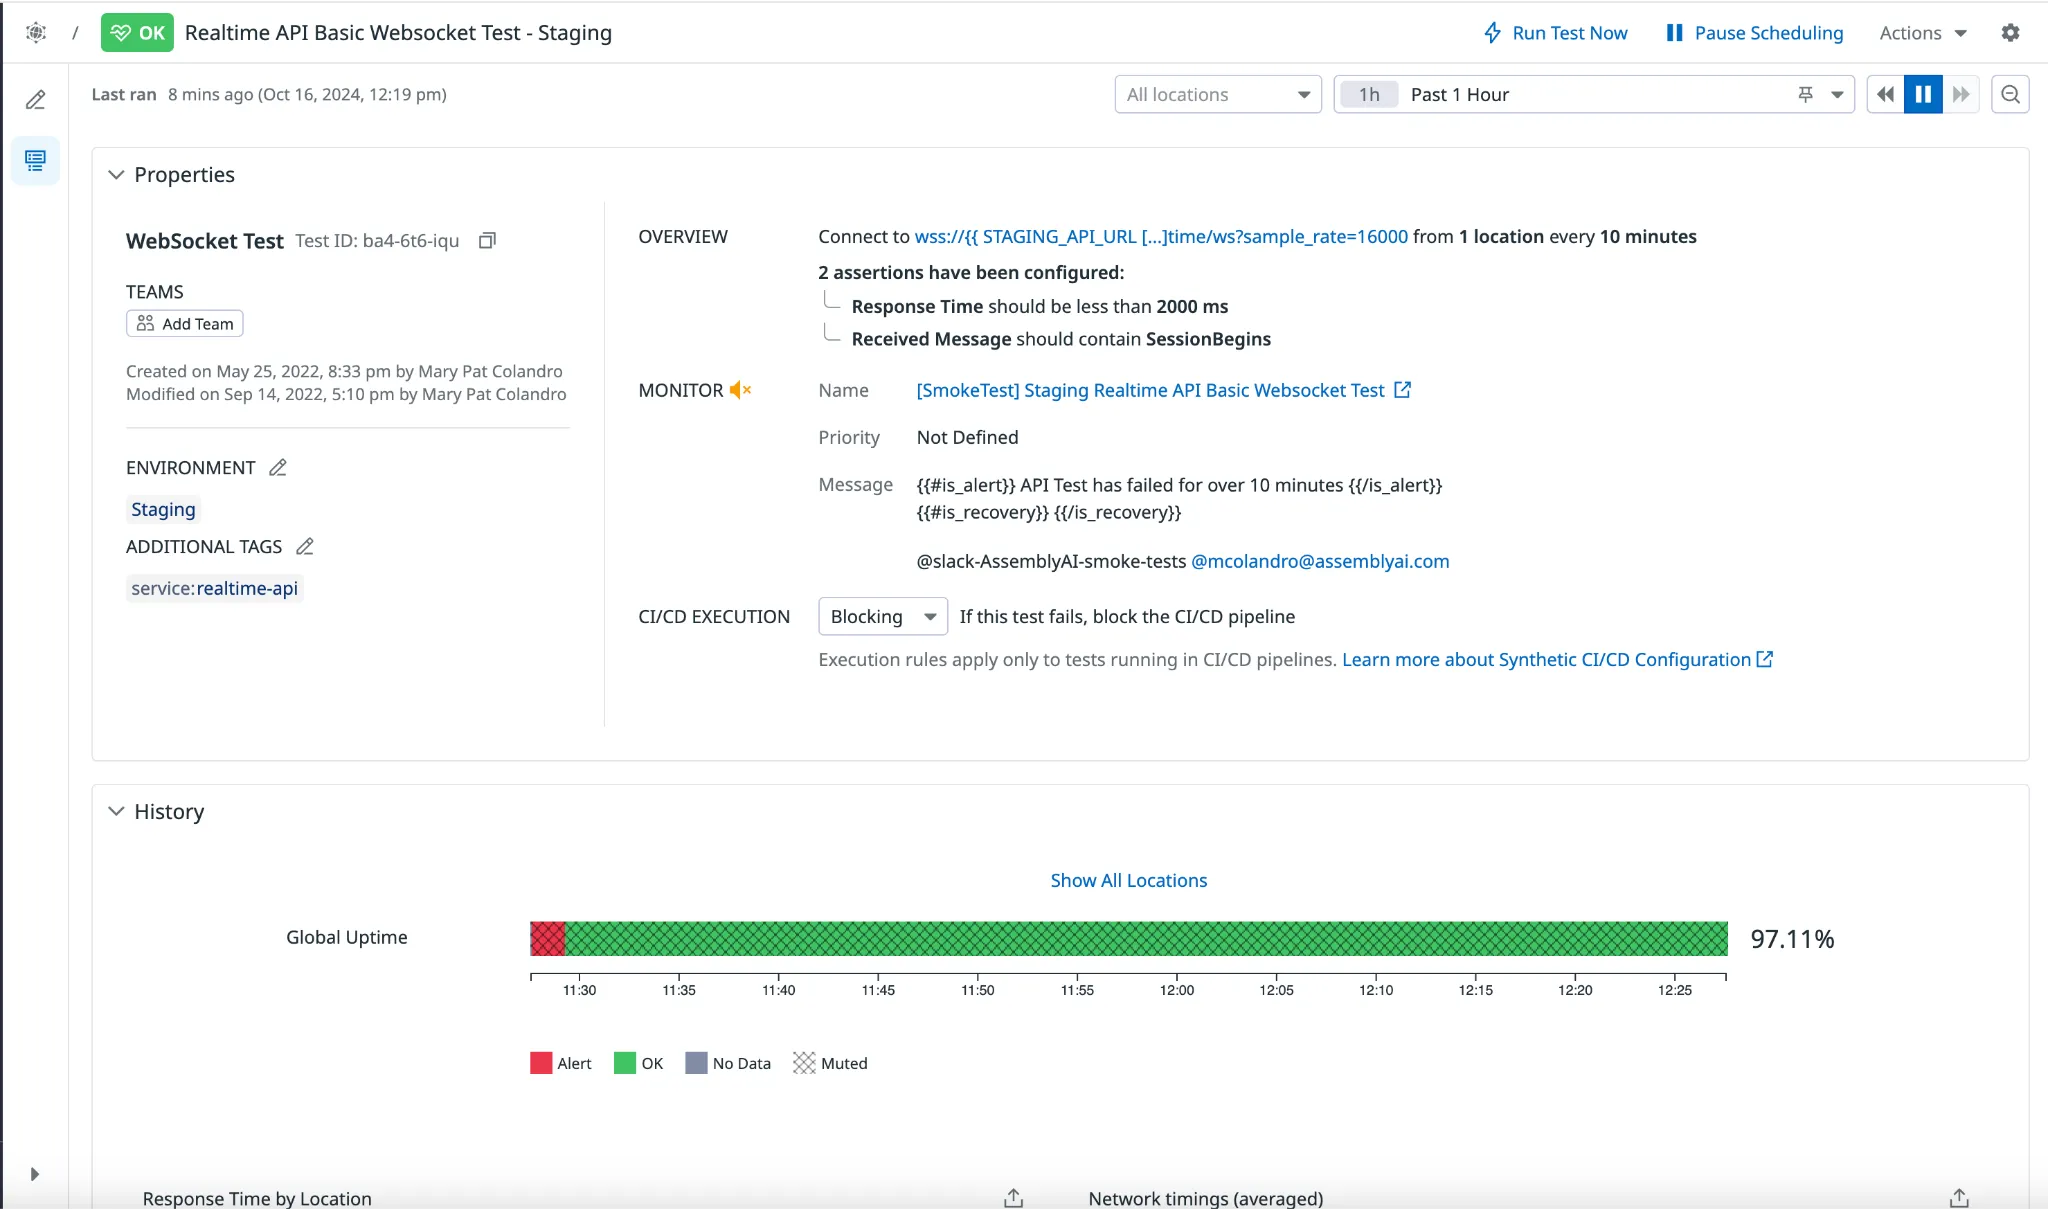
The tests runs section shows the most recent tests, and you can filter by passed / failed as well as manually triggered / scheduled.

Click into one of the test runs to view the details.
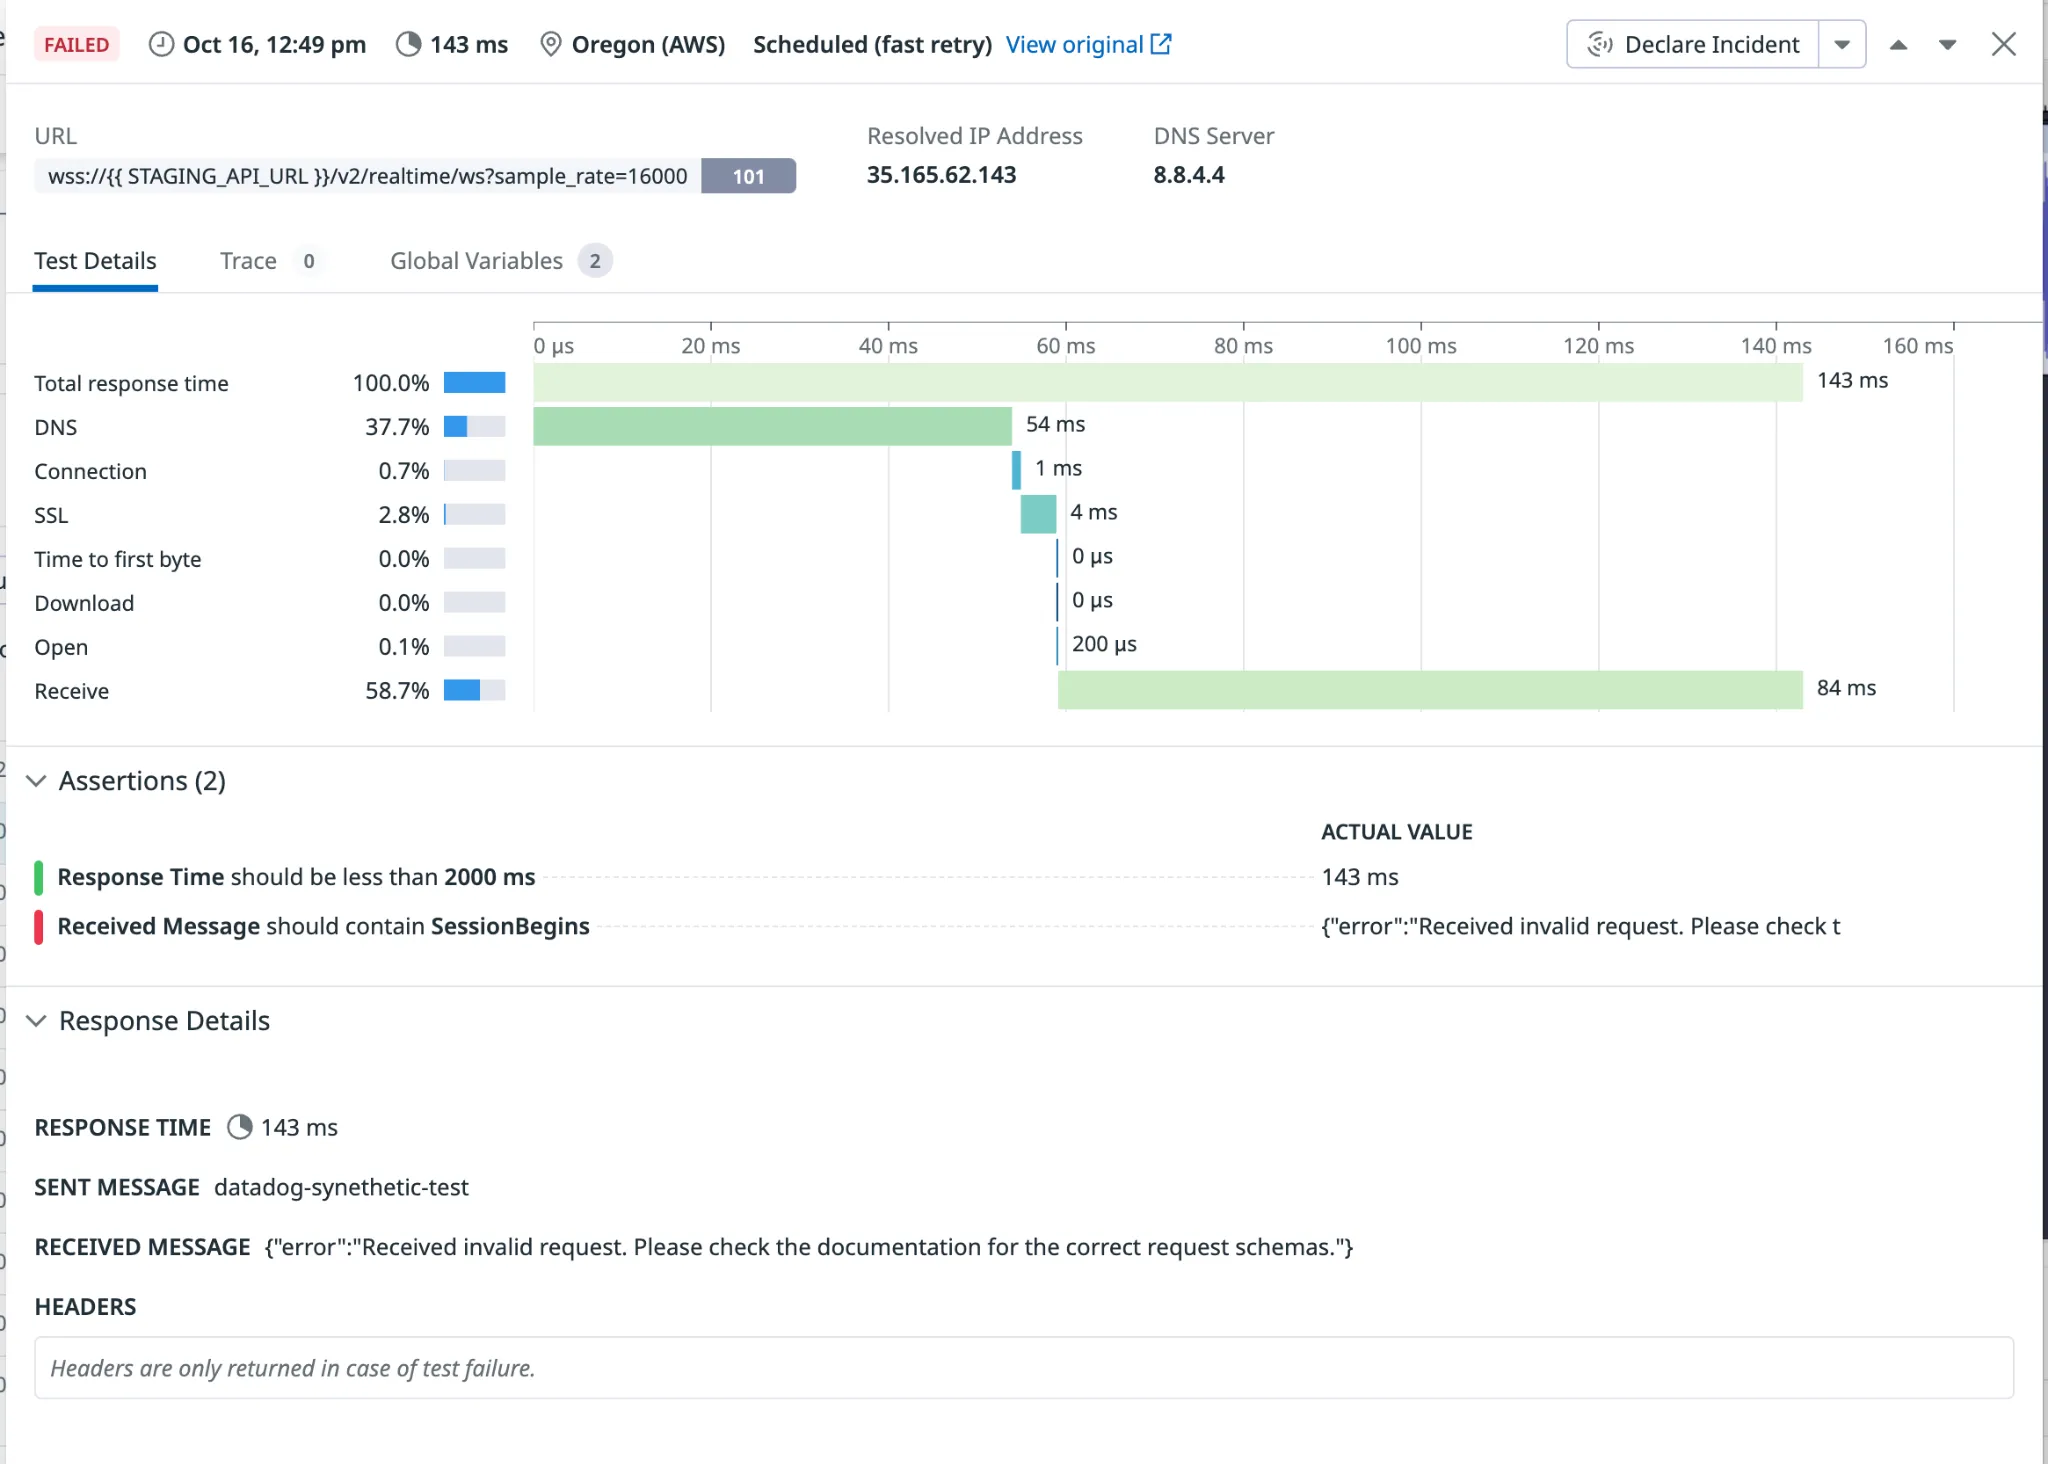
From the details page, we can see the result of the assertions.
The failed assertion is visible, detailing that an error occurred due to an invalid request.