
Weekly Pylon Summary Playbook
Introduction
Every week, members from CX, Engineering, and Research share updates asynchronously via the #csat-triage channel in Slack to discuss recent ticket trends and bug reports from our customer base. While bug reports are triaged and handled in Jira, the majority of info on customer trends is located in Pylon. To pass this info along effectively, there are a few things to do each week to surface this information to the wider company. Below is an example of what a Weekly Pylon Summary looks like.
Weekly Pylon Summary Outline :
📊 Weekly Pylon Summary – Support Ticket Trends & Feature Inquiries (Nov 24th-Dec 1st 2025)
Feature Inquiries/Missing Capabilities:
Async STT
- Description of feature-Company (link to salesforce) ($LTV)
- Description of feature-Company (link to salesforce) ($LTV)
Speech Understanding
- Description of feature-Company (link to salesforce) ($LTV)
- Description of feature-Company (link to salesforce) ($LTV)
Streaming STT
- Description of feature-Company (link to salesforce) ($LTV)
- Description of feature-Company (link to salesforce) ($LTV)
Platform Billing & Activation
- Description of feature-Company (link to salesforce) ($LTV)
- Description of feature-Company (link to salesforce) ($LTV)
LLM Gateway
- Description of feature-Company (link to salesforce) ($LTV)
- Description of feature-Company (link to salesforce) ($LTV)
Roadmap Items with Customer Interest:
- Description of feature-Company (link to salesforce) ($LTV)
- Description of feature-Company (link to salesforce) ($LTV)
See this channel for official product requests.
📈 Trend Highlights (generated by PylonAI, but happy to provide additional info or examples upon request):
Total Customer Support Tickets:
- This week: 206 ⬇️
- Prev week: 222
- Most popular topic: Account
Trends:
Copy revelant items from Pylon AI’s output. Example:
Transcription Problems (Multiple Issues)
- Transcription failures and processing errors -10 tickets
- Quality issues, including speaker diarization problems, language detection errors, and accuracy concerns- 7 tickets
Payment and Billing Issues
- Balance not updating, payment processing problems, and billing inquiries- 8 tickets
API and Authentication Problems
- WebSocket connection errors, API key issues, and timeout problems- 5 tickets
Account Access and Setup Issues
- Problems accessing services like LeMUR and general account functionality- 4 tickets
Tasks
-
Document Feature Requests & Ticket Topic Volumes
- On the Bug Triage analytics dashboard in Pylon, you’ll find ticket topic volumes at the top in a bar graph, with ticket count just below it. Feature requests and missing feature information will follow on the page. This will be the main source of information for the Weekly Pylon Report.
-
Determine Weekly Takeaways / Trends
- On top of the quantitative metrics of which topics were popular and which product areas had the most feature requests, it’s also important to review specific tickets and trends across that week. For this step, you’ll prompt Pylon AI to find the common customer issues over the past week. For consistency, you can prompt “What were the most common customer issues from the past week?”. Review the output and spot-check some tickets to get a sense of any trends or highlights.
-
Compare Ticket Volume WoW
- The Bug Triage dashboard includes a ticket count from the time period you’ve selected (typically the last 7 days). You should use this to compare ticket volumes from the previous week to see if tickets have increased or decreased in volume.
-
Present Findings in Bug Triage
- Support will share its findings in the #csat-triage channel.
Step 1: Document Feature Requests, Missing Capabilities & Ticket Topic Volumes
Head to Pylon to find the info you need for feature requests and ticket topic volumes. First, start by finding the most popular ticket topic from the graph and add that to the appropriate spot in the Pylon Summary Outline.
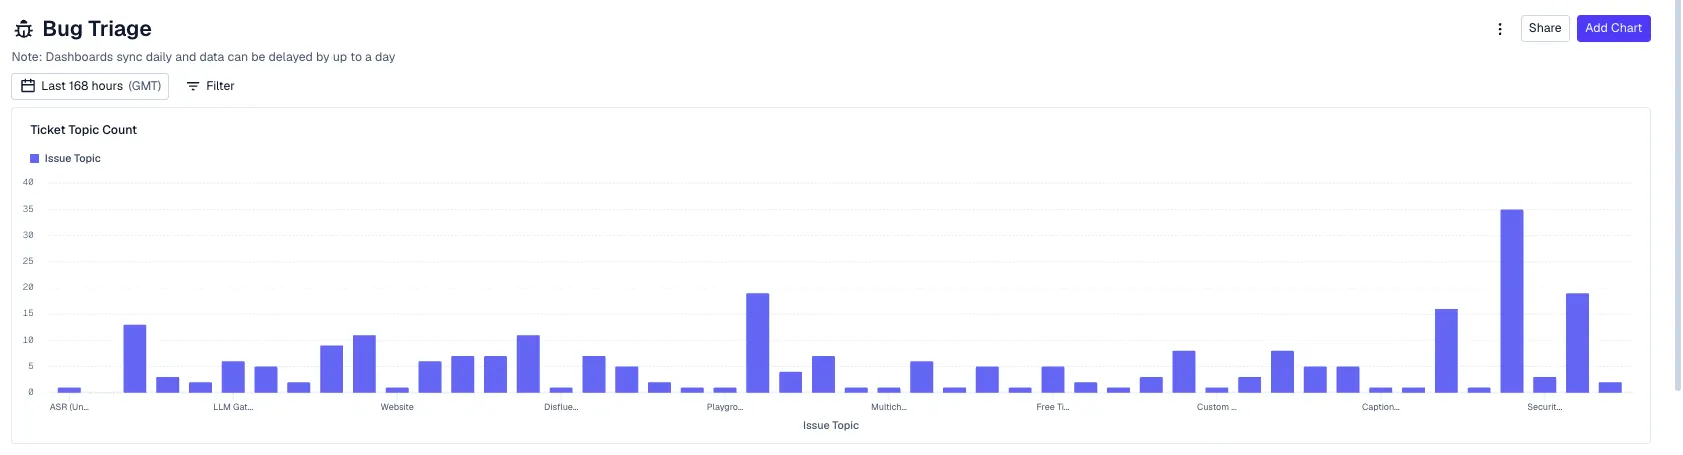
An example of the Ticket Topic graph. Mouse over the graph to get counts for specific categories shown on the graph. You can use the date picker located above the graph to change the specified date range.
Next on the page you’ll see the total ticket count. Add that to the appropriate spot in the Pylon Summary outline. Check the ticket count for the previous week as well by changing the filtered dates to the week before the last. Add this ticket count to the appropriate spot in the report outline. Use an ⬆️ or ⬇️ emoji to indicate if ticket volume increased or decreased from the last week.

Now you can move on to Feature Requests. In this section, you’ll see the total number of feature requests, a list describing the requests, and a pie chart containing each request. You can click on a slice of the pie chart.
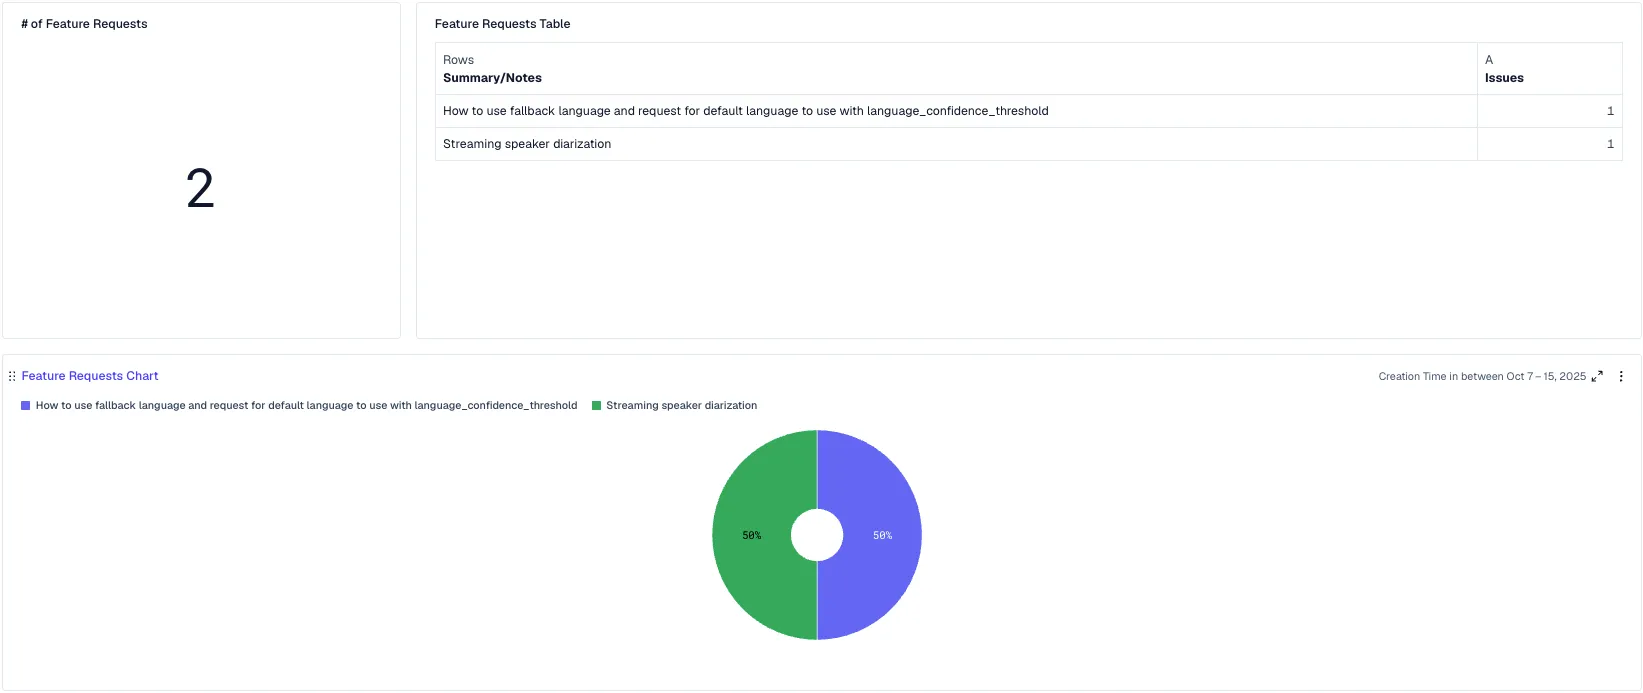
This opens up a modal with a “View issue” option.
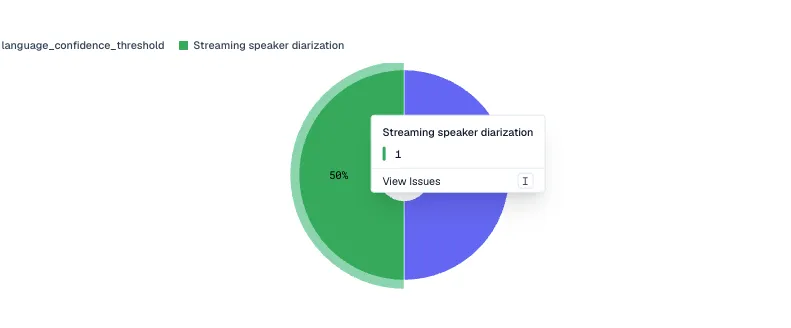
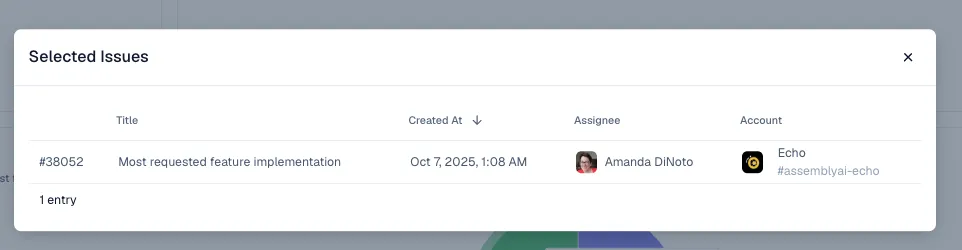
Click on it to view the specific issue where the request was raised. You can click on the follow up modal to view the full customer conversation.
Note: since tickets are labeled by AI, some of the listed issues will be unrelated to feature requests or missing capabilities. Double-check the ticket’s contents before adding it to the weekly pylon summary.
Scan through the ticket to gain context on the customer’s ask. From the ticket, you can find the additional info you’ll need for the weekly summary, including:
- Salesforce link
- Company name/email
To find the LTV, you’ll need to check their account email in Stripe. Search the customer’s email address (you may have to search just the domain). Get the customer’s all-time total spend and input that value as the LTV.

You’ll need to categorize each request into the correct product area yourself. Some of these requests will already be on our roadmap. You can put them in the “Roadmap Items With Customer Interest” section so that the engineering team is aware that customers have been asking about this feature over the past week.
After recording and categorizing the feature requests, scroll down in the bug triage analytics page in Pylon, and you’ll find the same components for missing features including the ticket count, a short description of each missing capability, and the pie chart of these missing capabilities.
Follow the same steps that you did for the feature requests, including viewing each issue, getting the company name, getting their Salesforce link, and their LTV. Categorize their request in the appropriate category.
Step 2: Prompt Pylon AI for Weekly Takeaways / Trends
Next, you’ll prompt Pylon AI to find the common customer issues over the past week. For consistency, you can prompt “What were the most common customer issues from the past week?”.
Pylon AI’s output will give you the common customer issues over the past week and specific related tickets. Typically, you can copy and paste the output in the appropriate section of the Pylon Summary Outline. You can click on the little numbers next to the trend summary to view the related tickets. The little numbers represent the number of related tickets; make sure to share that value in your summary as well. These prompts are stored in your Pylon AI history, so if engineering/research ever asks for more context, you can revisit specific tickets related to shared trends.
It’s also important to call out incidents that may have occurred this week, anecdotal trends you may remember from the tickets you handled that week, and other feedback that you believe best represents the voice of the customer. More info is good info!
Step 4: Present Findings in #csat-triage
You’re nearly done! Now, early in the week, run through these steps to make your Pylon Summary for the week. Then post your final report in #csat-triage.